
Figure 1.
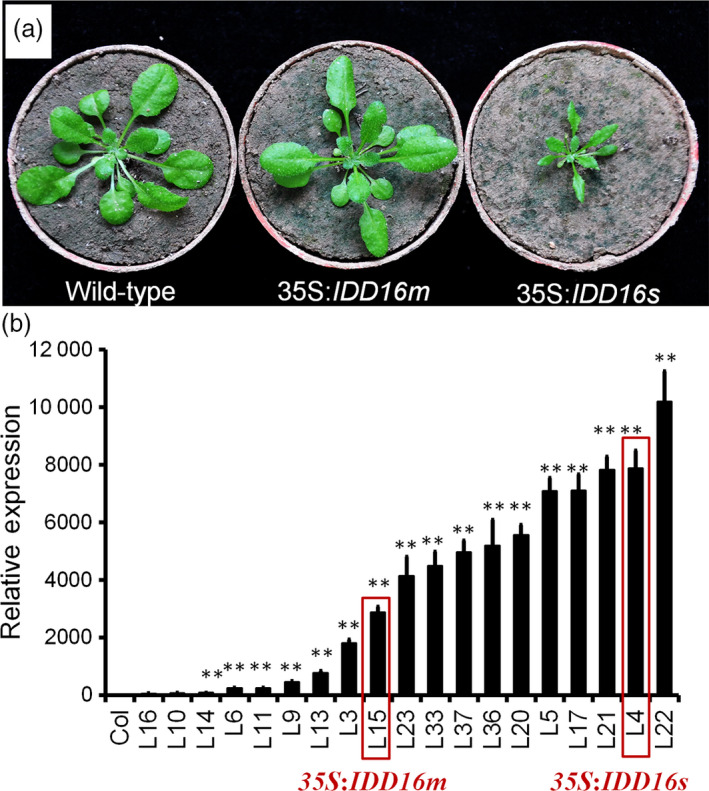
Growth phenotype of wild‐type, 35S: IDD16m and 35S: IDD16s plants. (a) Morphological phenotype of wild‐type (Col‐0), 35S: IDD16m (mild) and 35S: IDD16s (severe), which were grown in soil for 3 weeks, and representative individuals were photographed. (b) The expression level of IDD16 in transgenic lines. qRT‐PCR was performed on total RNA from 4‐DAG wild‐type and IDD16‐OE plants. Values are means ± SE from three biological replicates. Asterisks indicate statistical significance based on Student's t test; ** P < 0.01.