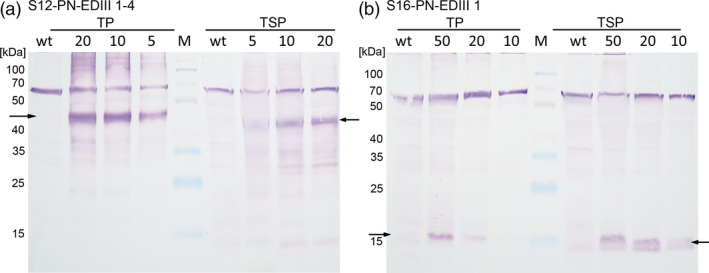
Figure 4.

Western blot analysis of EDIII antigen accumulation in transplastomic lettuce plants. (a) TP and TSP isolated from plant line S12‐PN‐EDIII‐1‐4. (b) TP and TSP isolated from plant line S16‐PN‐EDIII‐1. The amount of TSP/TP loaded is given above the respective lane in μg. Twenty microgram TP/TSP was loaded for the wild‐type in a), while 50 μg TP/TSP was loaded for the wild‐type in b). The arrows indicate the 47 kDa EDIII‐1‐4 and the 13 kDa EDIII‐1. M: spectra multicolour broad range protein ladder (Thermo Scientific, molecular weight of the marker bands indicated in kDa). The band migrating at 70 kDa results from non‐specific binding of the antibody to a plant protein of unknown identity (Gottschamel et al., 2016).
