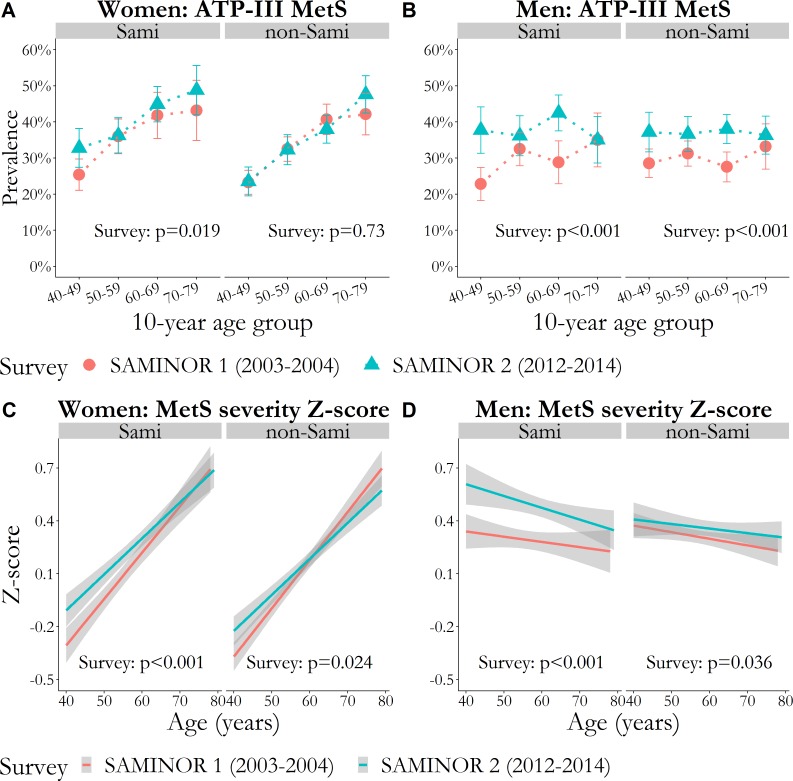
Figure 2.
P values for survey are age-adjusted and were obtained with GEE logistic or linear regression. Models were stratified by sex and ethnic group. (A and B) Prevalence of MetS defined by the harmonised ATP-III criteria, per 10-year age group with vertical error bars (95% CI). (C and D) Mean of MetS severity Z-score as a function of age with 95% CI bands shaded in grey. ATP-III, Adult Treatment Panel III; GEE, generalised estimating equation; MetS, metabolic syndrome.

