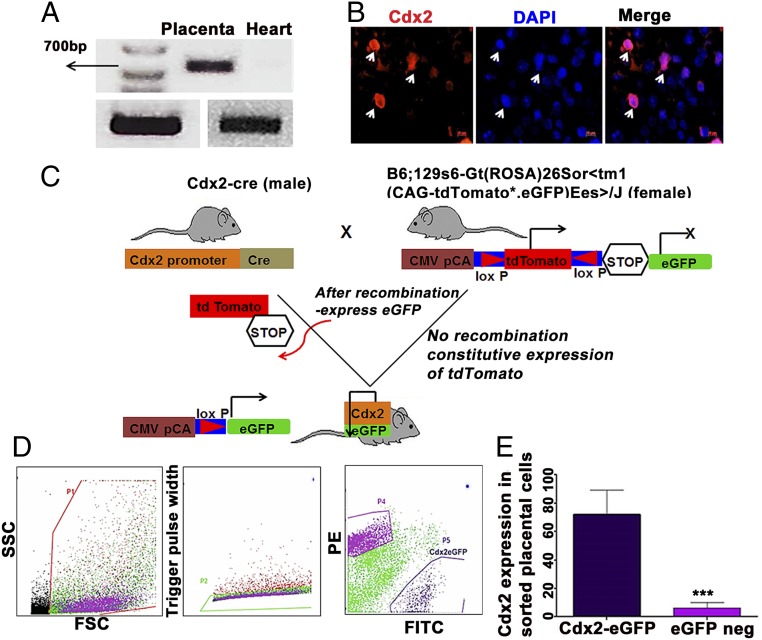
Fig. 1.
Cdx2 expression and lineage tracing. (A) Cdx2 messenger RNA (mRNA) expression in an e18 WT mouse placenta relative to the endogenous control gapdh (n = 3 mice). Heart mRNA at e18 served as the negative control. Please refer to additional data in SI Appendix for the original gel image file. (B) WT e18 placental cells positive for Cdx2. A representative immunofluorescence image depicting Cdx2 antibody staining on WT placental cells is shown. Cdx2 (red) and nuclei were counterstained by DAPI (blue) (n = 3 mice). (Scale bar: 10 μm.) (C) Illustration of Cre-Lox transgenic mouse strategy to trace Cdx2-derived cells. (D) Flow cytometry gating strategy and isolation of e18 eGFP–tagged placental Cdx2 cells. FITC, fluorescien isothiocyanate; FSC, forward scatter; PE, phycoerythrin; SSC, side scatter. (E) Cdx2-eGFP and eGFP− cells were immunostained using monoclonal Cdx2 antibody and analyzed by flow cytometry. Data are represented as mean ± SEM. ***P = 0.0013 from three different samples (n = 3).

