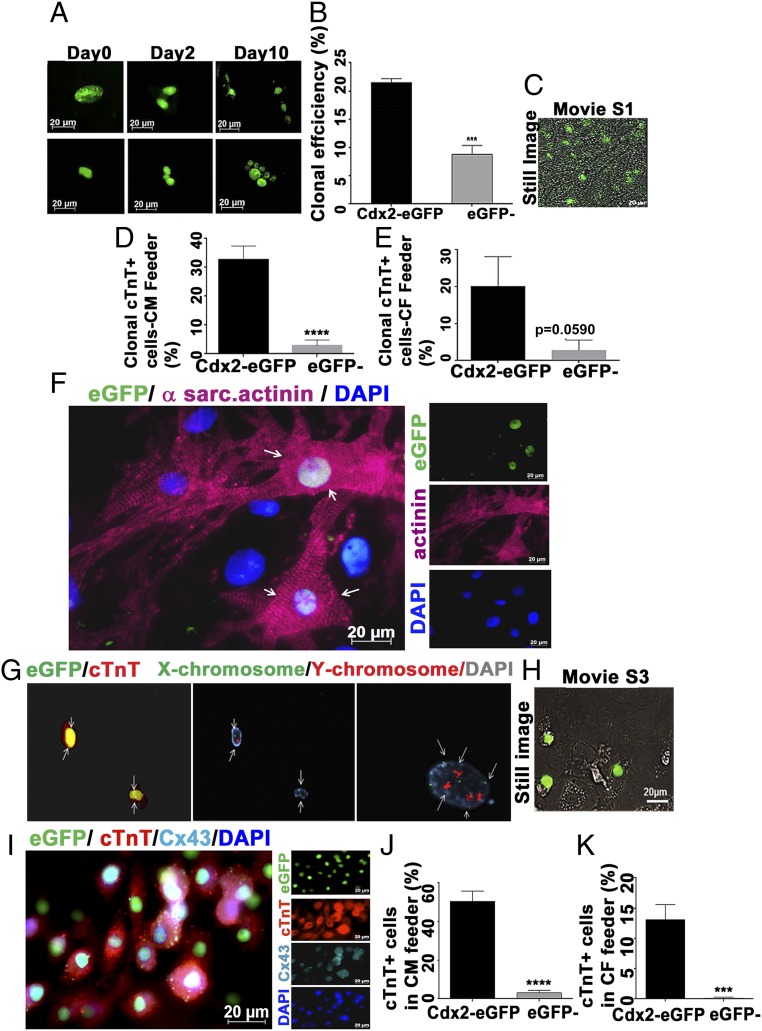
Fig. 2.
Clonal proliferation and cardiac differentiation of Cdx2-eGFP cells in vitro. (A) Single-cell sorting of eGFP cells was utilized to assess the clonal proliferation through live cell imaging for 10 d in a CF feeder. (B) Clonal efficiency of Cdx2-eGFP cells and eGFP− cells was calculated from the proliferative wells in the CF feeder (n ≥ 3 mice) (Table 1). Data are represented as mean ± SEM. ***P = 0.0005. (C) Still image from the Movie S1 depicting spontaneous beating of clonal cultures of Cdx2-eGFP cells after 4 wk in a CM feeder. (D and E) Cdx2-eGFP cells generated significantly more CMs in both CM (****P < 0.0001) and CF feeder systems. Data are represented as mean ± SEM (n = 3). (F) Representative field showing a differentiated Cdx2-eGFP cell expressing a sarcomeric structure (α-sarcomeric actinin, pink) when cultured on neonatal CM feeders for 5 wk. White arrows indicate the differentiated Cdx2-eGFP cell with sarcomere formation. (G) XY chromosome analysis (FISH) demonstrates a single set of sex chromosomes (Center; white arrows point to cells with either XY-red/green or XX-green chromosomes) in cTnT+ (red) eGFP cells (Left; white arrows), thus excluding cell fusion. (Right) Non-eGFP feeder CM with a tetraploid nucleus (white arrows). (H) Still image from Movie S3 showing spontaneous beating of Cdx2-eGFP CMs. (I) Connexin 43 (Cx43) expression is detectable in early-differentiating cTnT+ Cdx2-eGFP cells as early as 3 wk in culture [GFP, green; cTnT, red; Cx43, cyan; nuclei, blue (DAPI)]. Quantification of cardiac differentiation of Cdx2-eGFP and eGFP− cells on a CM feeder (J) and a CF feeder (K) is shown. Data are represented as mean ± SEM (n = 3). ****P < 0.0001, ***P = 0.0005.

