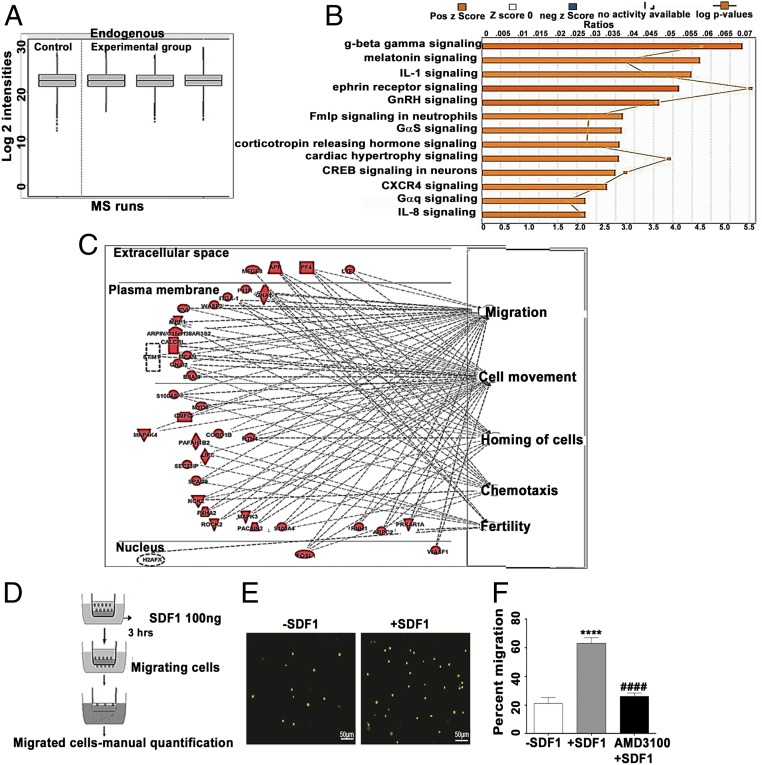
Fig. 5.
Comparison of whole-cell proteome of Cdx2-eGFP cells vs. ES cell control (ESC). (A) Quality control plot of mass spectrometry (MS) data. Quartiles and intensities were aligned between files to ensure that samples were similarly loaded. Run 1, ESC; Run 2, Cdx2-eGFP cells mouse 1; Run 3, Cdx2-eGFP cells mouse 2; Run 4, Cdx2-eGFP cells mouse 3. Six micrograms of protein was loaded on the column for each run. (B) IPA z-scores reflecting functions up-regulated in Cdx2-eGFP cells. (C) Top five cell functions predicted increased activation in Cdx2-eGFP cells relative to ESC. (Right) Cell function. (Left) Up-regulated proteins, graphed according to subcellular localization. (D) Schema depicting the transwell chemotaxis experiment. (E) Representative images of migrating Cdx2-eGFP cells in the absence (−SDF1) and presence (+SDF1) of SDF1. (Scale bars: 50 μm; Magnification: 20×). (F) Quantification of migration of Cdx2-eGFP cells to SDF1α in the presence and absence of the CXCR4 inhibitor AMD3100, showing the possible role of SDF1-CXCR4 signaling in the migration of Cdx2-eGFP cells. Data are represented as mean ± SEM (n = 4) −SDF1 vs. +SDF1: ****P ≤ 0.0001, +SDF1 vs. AMD3100, ####P ≤ 0.0001.

