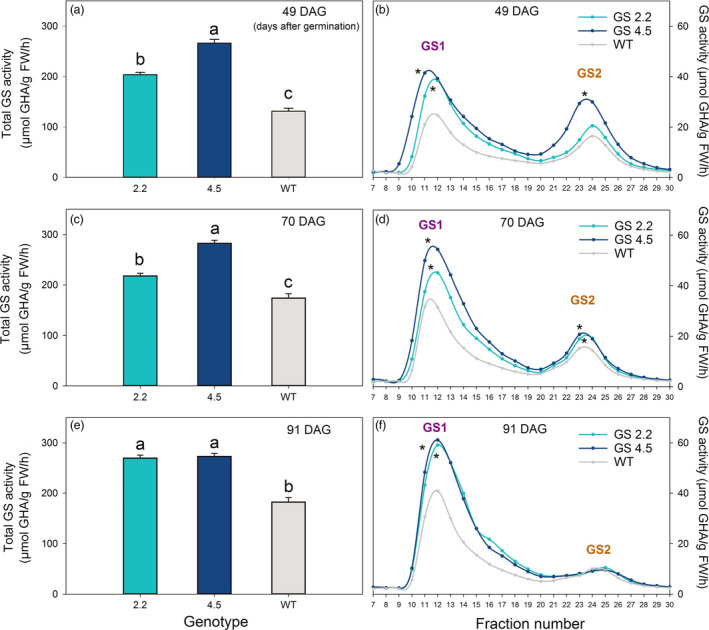
Figure 1.

GS activity of two HvGS1‐1 cisgenic lines (T3, 2.2 and 4.5) and wild‐type grown in soil with high N supply (0.6 g N/L soil). (a) Total GS activity in the two youngest fully developed leaves of plants at 49 days after germination (DAG; before ear emergence). (c) Total GS activity in the two upper leaves (flag leaf and the second leaf) from the main stem of plants at 70 DAG (after ear emergence) and (e) at 91 DAG (grain filling). Data represents mean values ± SE, n = 6. Different letters indicate significant difference (P < 0.05, Fischer LSD) between cisgenic lines and wild‐type. (b) Separate activities of cytosolic GS (GS1) and chloroplastic GS (GS2) in the two youngest fully developed leaves of plants at 49 DAG. (d) Separate activities of GS1 and GS2 in the two upper leaves from mean shoots of plants at 70 DAG and (f) at 91 DAG. The first peak corresponds to GS1 and the second peak to GS2 as confirmed by western‐blot analysis (Figure S3). GS1 and GS2 were separated on a Mono Q 5/50 GL anion column using Fast protein liquid chromatography (FPLC). Their activities in the different elution fractions were measured by the transferase assay and the produced γ‐GHA (γ‐glutamyl hydroxamate) quantified spectrophotometrically at 540 nm using synthetic GHA to prepare calibration standards. Symbols * close to the peak indicates significant difference of GS1 or GS2 activity between the cisgenic lines and wild‐type.
