
Figure 4.
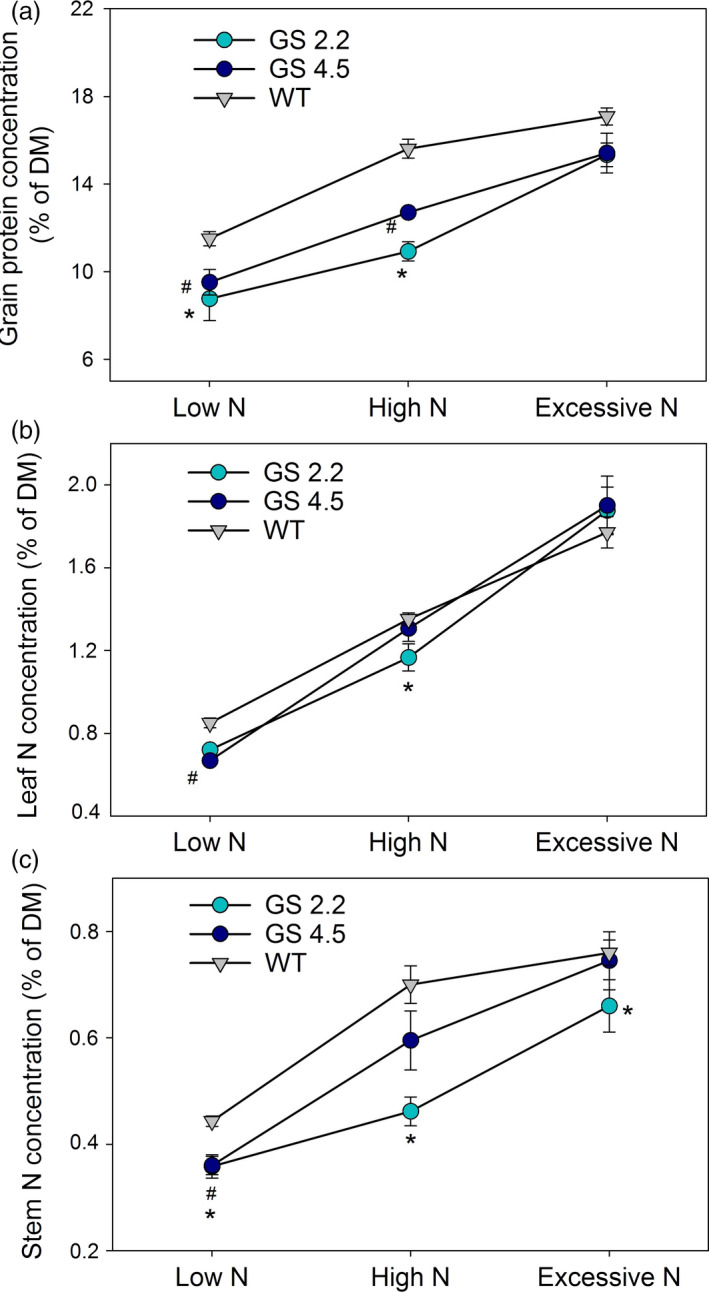
Grain protein concentration and N concentration in leaf and stem at maturity of two HvGS1‐1 cisgenic lines (T3, 2.2 and 4.5) and wild‐type grown under low (0.2 g N/L soil), high (0.6 g N/L soil) and excessive (1.0 g N/L soil) N supply. (a) Grain protein concentration, (b) stem N concentration and (c) leaf N concentration. Data are presented as means ± SE (n = 6). Significant differences (P < 0.05, Fischer LSD) between cisgenic lines and the wild‐type inside each N treatment are indicated by # or * for line 4.5 and 2.2, respectively.