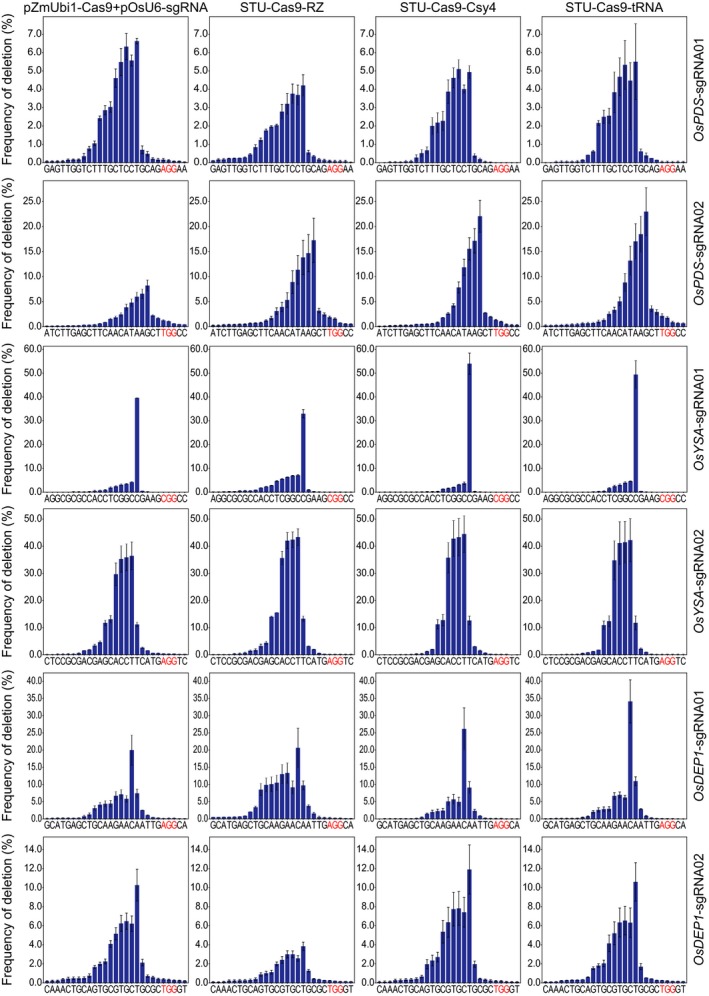
Figure 2.

Comparison of positional deletion frequencies at six target sites. The experiments were carried out in rice protoplasts and the frequencies were measured by amplicon‐based deep sequencing. The PAM sites are highlighted in red. Each line represents the same target site, while each column represents the same Cas9 expression strategy. Error bars represent standard deviations of two biological replicates.
