Fig. 2.
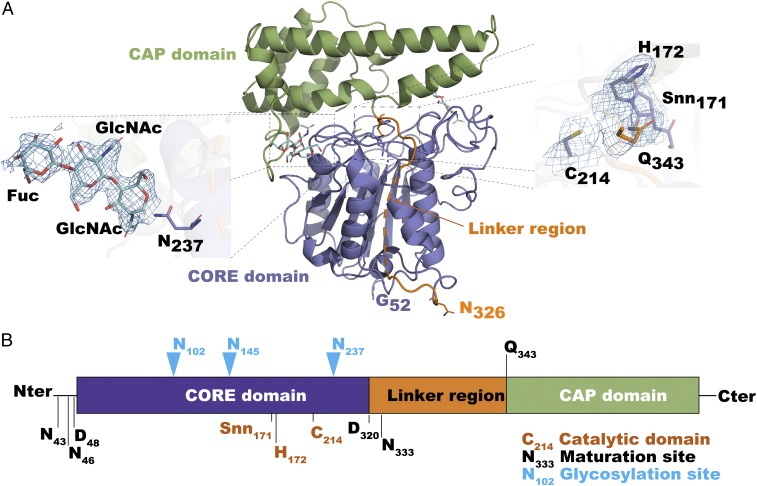
Crystal structure of VyPAL2. (A) The VyPAL2 monomer: Its cap region is colored in green, core in purple, and linker in orange. N-glycosylation sites are displayed as cyan sticks. (A, Insets) Active-site residues (Right) and one representative glycosylation site (Left). The electronic density map (with Fourier coefficients 2Fo − Fc and phases from the model) is overlaid and contoured at 1-sigma level. (B) Diagram of VyPAL2 protein domains. Blue arrowheads indicate glycosylation sites. Cleavage sites as determined by LC-MS/MS are indicated. Active-site residues (His172 and Cys214) as well as succinimide 171 are labeled.

