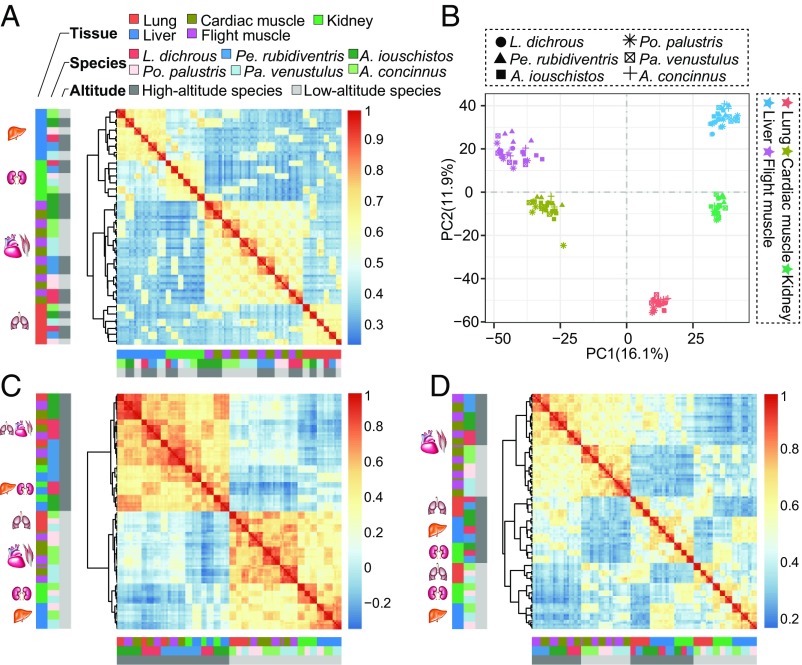
Fig. 2.
Gene expression patterns across the 6 tit species: Lophophanes dichrous, Periparus rubidiventris, Aegithalos iouschistos, Poecile palustris, Pardaliparus venustulus, and A. concinnus. (A) Symmetrical heat map of Spearman’s correlation coefficients between all pairs of samples across all genes. (B) PCA of the log-transformed normalized expression levels of all orthologs across all species and tissues. Species are represented by point shape; tissues are represented by point color. (C) Symmetrical heat map of Spearman’s correlation coefficients between all pairs of samples across genes differentially expressed between all 3 high- and low-altitude pairs (see SI Appendix, Materials and Methods for details). Key is as in A. (D) Symmetrical heat map of Spearman’s correlation coefficients between all pairs of samples across genes associated with altitude (see SI Appendix, Materials and Methods for details). Key is as in A. Data are hierarchically clustered (complete method, correlation distance) in A, C, and D.

