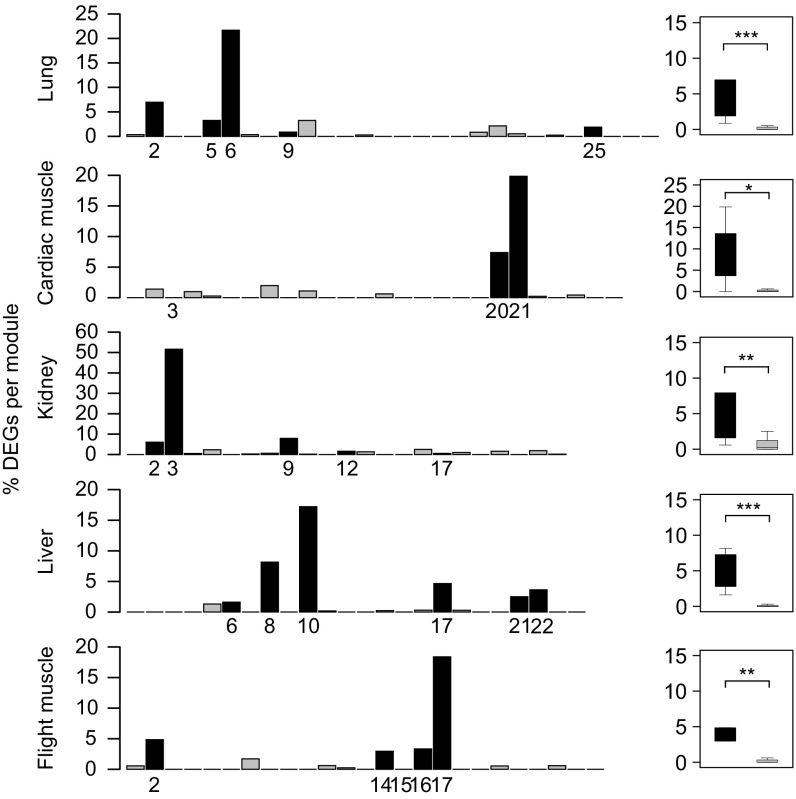
Fig. 3.
Relative numbers of differentially expressed genes (DEGs) identified in each module for each tissue. Black bars represent altitude-associated modules, and gray bars represent all other modules. Altitude-associated modules are labeled. The box plot shows the relative number of DEGs in altitude-associated modules compared with the other modules. The P value above each pair indicates the significance of the difference in relative number of DEGs between altitude-associated and non-altitude-associated modules (Mann–Whitney U test). Displayed significant scores are ***P < 0.001, **P < 0.01**, and *P < 0.05.

