
Figure 5.
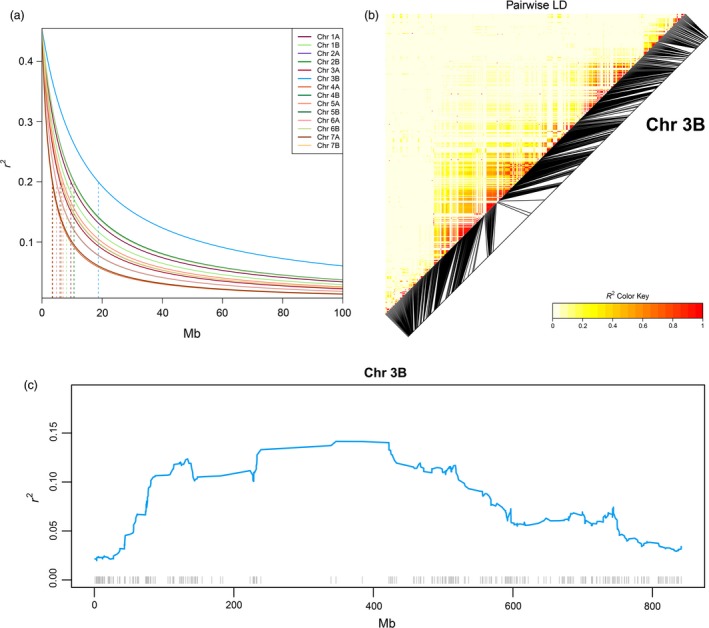
Linkage disequilibrium (LD) in the EtNAM subset. (a) LD (y‐axis) decay over physical distance (x‐axis) in each Chr, coloured according to the legend. The distance needed for a lack of LD (r 2 = 0.2) is represented by vertical dashed lines for each Chr. (b) Pairwise LD measures on Chr 3B, the Chr with the slowest LD decay. Markers are ordered according to their physical positions, and black segments are projected onto their map position. Increasing values of r 2 are reported in increasing shades of red according to the legend. (c) LD evolution across Chr 3B. LD measures are averaged within genomic bins and represented as a continuous line coloured as per panel (a). The Mb positions across the Chr are shown on the x‐axis. Molecular markers available on Chr 3B are represented by grey ticks at the bottom of the plot in the corresponding physical positions.