
Figure 4.
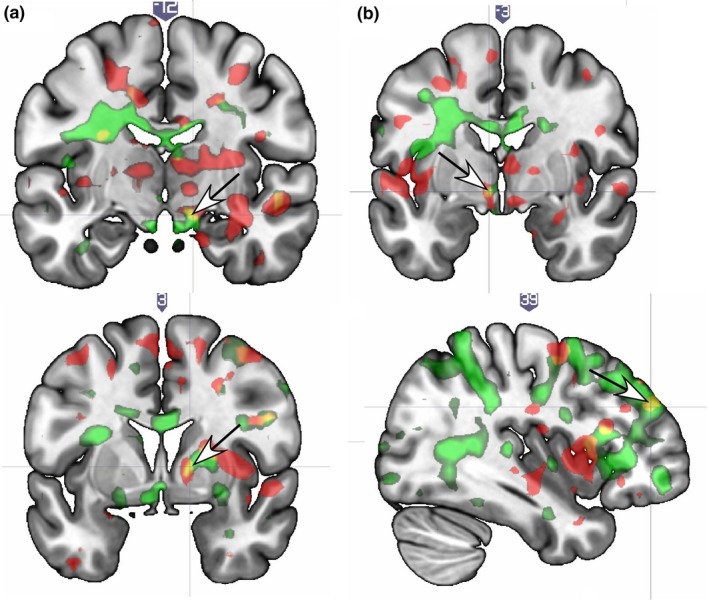
Brain localizations showing significant brain response interactions with sex frequency (times/week) and OXTR or AVPR. (a) At both T1 and T2 the substantia nigra region shows an interaction for AVPR (arrow) and sex frequency, which is the same region that correlated with sexual satisfaction (see Figure 1a). (b) The hypothalamus/paraventricular region showed an AVPR interaction at T1 and T2 (arrow). (c) The globus pallidus shows an interaction with OXTR at T1 and T2 (arrow). (d) The dorsolateral prefrontal cortex shows an interaction with OXTR at T1 and T2 (arrow). Legend. OXTR = Red; AVPR = Green