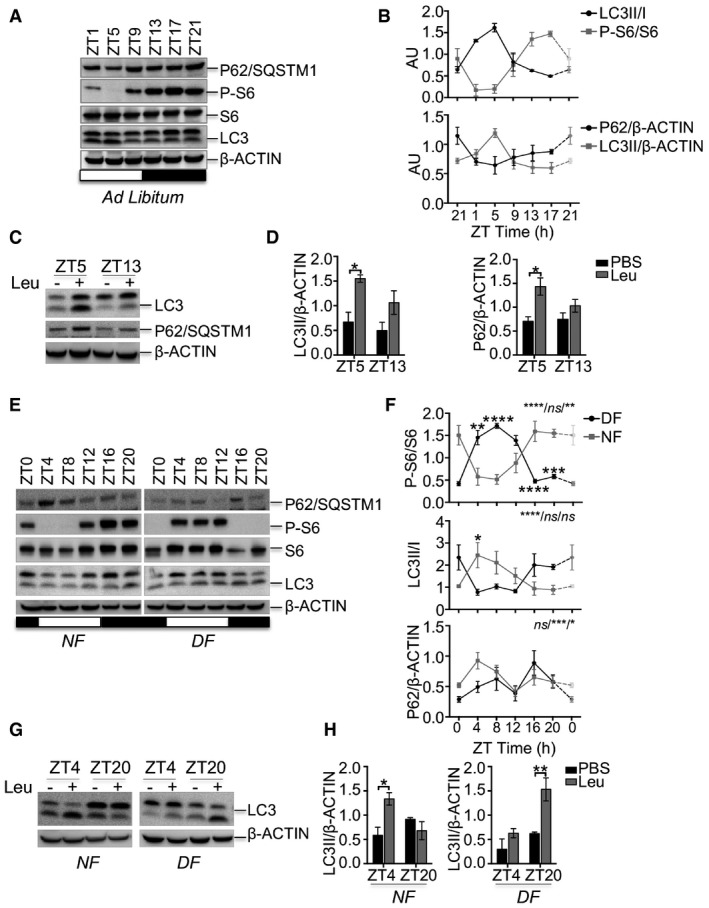
Figure EV1. Activation of autophagy and mTORC1 pathways depends on feeding time.

-
A, BAutophagy markers (LC3 and P62/SQSTM1) and mTORC1 activity as indicated by the phosphorylation of S6 ribosomal protein were measured during the 24‐h cycle in the liver from mice fed ad libitum. The plots represent average values of n = 3 for each time point expressed as ratio of LC3II/LC3I or LC3II/actin, p62/actin, and phosphorylated S6 versus pan‐S6. ZT21 is double‐plotted for visualization. Data are represented as mean ± SEM.
-
C, DAutophagy flux analysis in liver from WT mice fed ad libitum injected with leupeptin or PBS (C) and relative quantification (D) (n = 3 per group). Data are presented as mean ± SEM (two‐way ANOVA test followed by the Bonferroni post hoc test: *P < 0.05).
-
E, FAutophagy markers and mTORC1 activity as indicated by the phosphorylation of S6 ribosomal protein measured during the 24‐h cycle in the liver from mice fed during the night (NF) or during the day (DF). The plots represent average values of n = 3 for each time point. The gray bars represent the dark cycle. Zeitgeber time ZT0: lights on; ZT12: light off. ZT0 is double‐plotted for visualization. Data are presented as mean ± SEM (two‐way ANOVA test (interaction/time/group) followed by the Bonferroni post hoc test: (ns non‐significant; *P ≤ 0.05; **P < 0.01; ***P < 0.001; ****P < 0.0001).
-
G, HAutophagy flux analysis in liver from WT mice fed during the night (NF) or during the day (DF) injected with leupeptin or PBS (G) and relative quantification (H) (n = 3 per group). Data are presented as mean ± SEM. (two‐way ANOVA test followed by the Bonferroni post hoc test: *P < 0.05; **P < 0.01).
Source data are available online for this figure.
