-
A
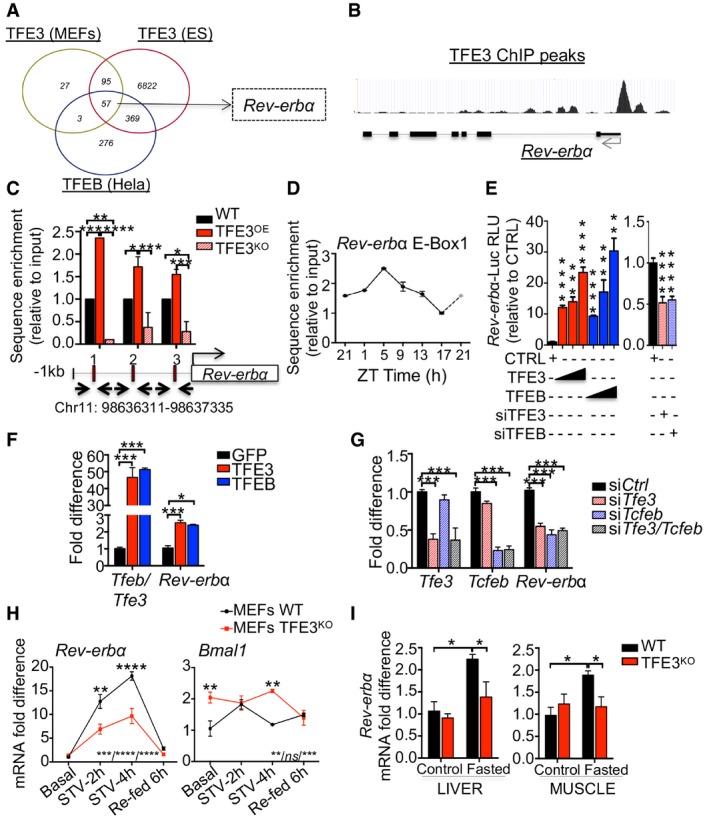
Venn diagrams showing cross‐comparison of TFEB‐ and TFE3‐bound genes based on published ChIP‐seq dataset.
-
B
TFE3 ChIP‐seq peaks in the promoter of
Rev‐erbα in ES cells (Betschinger
et al,
2013).
-
C
ChIP analysis of livers from mice of the indicated genotypes (n = 2–4 per group). E‐Boxes in the promoter region of Rev‐erbα are indicated by squares. Bar graph represents the amount of immunoprecipitated DNA as detected by qPCR assay. Values were normalized to the input and plotted as relative enrichment over the WT control. Data are presented as mean ± SEM. (two‐way ANOVA test followed by the Bonferroni post hoc test: *P ≤ 0.05; **P < 0.01; ***P < 0.001).
-
D
ChIP analysis for Rev‐erbα in WT livers at different time points (n = 3 per group/time point). Values were normalized to the input and plotted as relative enrichment over the ZT1 time point. ZT21 is double‐plotted for visualization. Data are represented as mean ± SEM.
-
E
Luciferase activity for Rev‐erbα promoter measured after transfection of increasing amount of TFE3‐GFP or TFEB‐GFP or with siRNA against TFE3 and TFEB (n = 3 per group). Data are represented as mean ± SEM (**P < 0.01; ***P ≤ 0.001; ****P ≤ 0.0001 Student's t‐test).
-
F, G
Quantification of mRNA levels of Rev‐erbα in Hepa1‐6 overexpressing (F) or knock‐down (G) for TFEB and TFE3 (n = 3 per group). Data are represented as mean ± SEM (*P ≤ 0.05; ***P ≤ 0.001 by Student's t‐test).
-
H
mRNA levels of Rev‐erbα in WT and TFE3KO MEFs in response to nutrient starvation/stimulation at the indicated time points (n = 3 per group). Data are presented as mean ± SEM. (two‐way ANOVA test (interaction/time/group) followed by the Bonferroni post hoc test: ns non‐significant; **P < 0.01; ***P < 0.001; ****P < 0.0001).
-
I
Transcript levels of Rev‐erbα in liver and muscle tissues isolated from mice with the indicated genotypes fasted for 24 h (n = 4–5 per group). Values were normalized to ribosomal protein S16 (Rps16) gene and expressed as fold change relative to control fed mice. Bars represent means ± SEM (two‐way ANOVA test followed by the Bonferroni post hoc test: *P ≤ 0.05).

