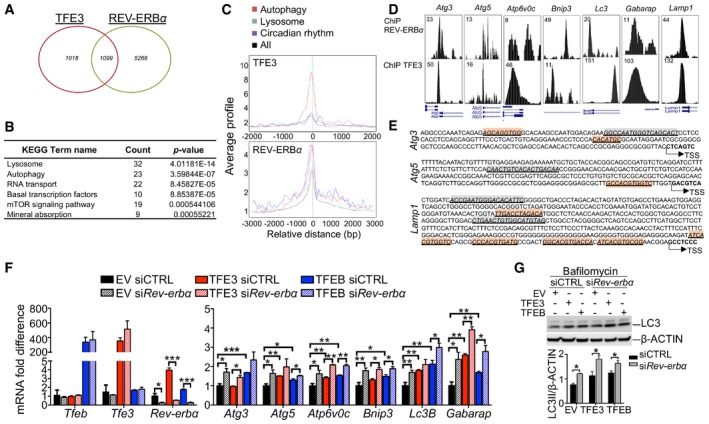
Figure 4. TFEB/TFE3‐mediated regulation of Rev‐erbα contributes to the oscillation of gene expression.

- Venn diagram depicting the unique and shared TFE3 and REV‐ERBα binding peaks identified as reported in the Materials and Methods section. Fisher's exact test P‐value < 2.2e‐16.
- KEGG analysis showing that shared TFE3 and REV‐ERBα peaks are enriched for genes involved in lysosome and metabolic pathway.
- Average TFE3 and REV‐ERBα signals from −1 kb to +1 kb to the transcriptional start site (TSS).
- TFE3 cistromes significantly overlap with REV‐ERBα in the promoter region of genes involved in autophagy and lysosome. Tag counts are shown in the corner.
- E‐boxes/CLEAR (red) sites and RORE (green) location in the promoter of their target genes. Arrows indicate the number from transcriptional start site.
- Expression analysis of autophagy‐related genes in Hepa1‐6 overexpressing TFEB or TFE3 and depleted for Rev‐erbα (n = 3 per group). mRNA levels were normalized using Rps16 and expressed as relative to cells transfected with scramble siRNA and empty vector. Data are represented as mean ± SEM (*P ≤ 0.05; **P ≤ 0.01; ***P ≤ 0.001 by Student's t‐test).
- Western blot analysis of Hepa1‐6 overexpressing TFEB or TFE3 and depleted for Rev‐erbα (n = 3 per group). Cells were treated with bafilomycin for 4 h before collection to analyze the autophagy flux. Data are presented as mean ± SEM. (two‐way ANOVA test followed by the Bonferroni post hoc test: *P ≤ 0.05).
Source data are available online for this figure.
