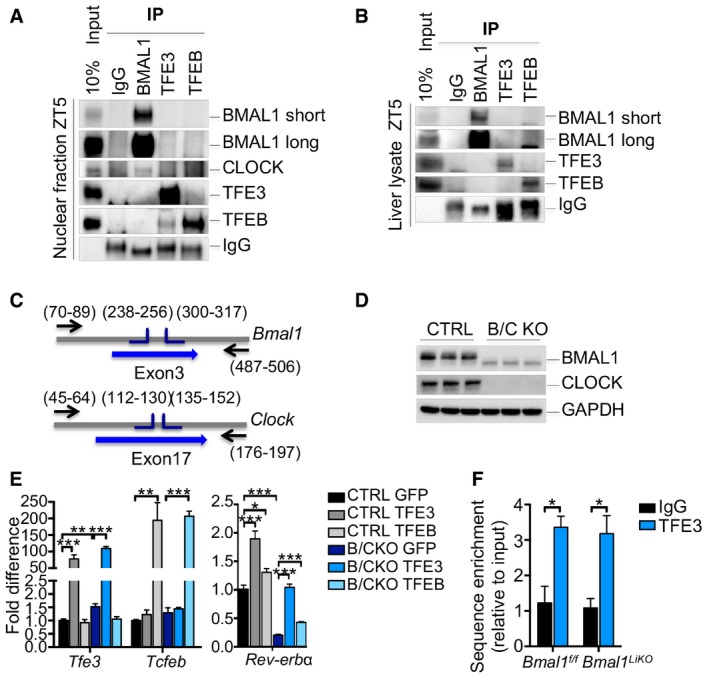
Figure EV4. TFEB and TFE3 act in parallel and not in combination with BMAL1/CLOCK .

-
A, BCo‐immunoprecipitation analysis using the indicated antibodies in nuclear fraction (A) or whole lysate (B) from liver of WT mice fed ad libitum at ZT5.
-
CRepresentation of the strategy used for the generation of the BMAL1/CLOCK KO (B/C KO) Hepa1‐6 cells using CRISPR/Cas9 technology.
-
DValidation of the B/C KO cells by Western blot analysis.
-
EqPCR analysis of WT and B/C KO cells overexpressing TFEB and TFE3 (n = 3 per group). Data are represented as mean ± SEM (*P ≤ 0.05; **P ≤ 0.01; ***P ≤ 0.001 by Student's t‐test).
-
FChIP analysis for Rev‐erbα in liver from mice of the indicated genotypes (n = 3 per group). Bar graph represents the amount of immunoprecipitated DNA as detected by qPCR assay. Values were normalized to the input and plotted as relative enrichment over the IgG control. Data are represented as mean ± SEM (*P ≤ 0.05 by Student's t‐test).
Source data are available online for this figure.
