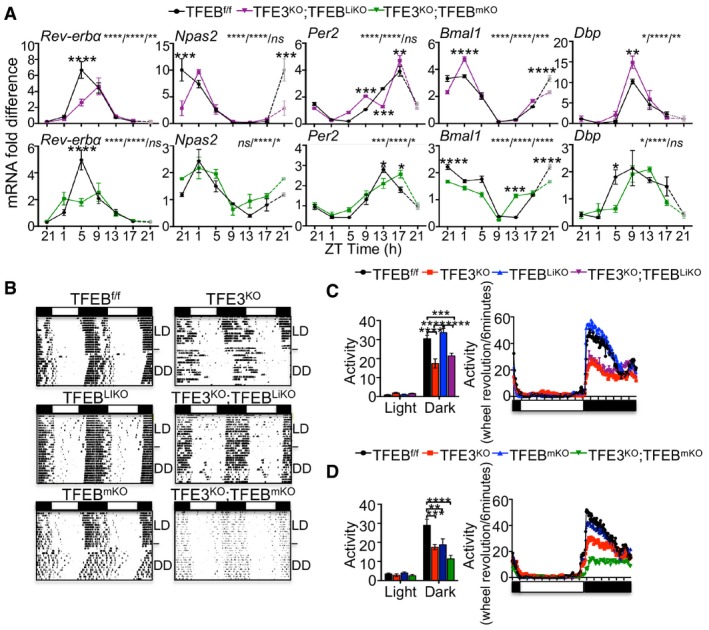
Figure 5. Disruption of circadian rhythm in TFEB/TFE3‐depleted mice.

-
AqPCR analysis of gene expression in liver (A) and muscle (B) from TFE3KO; TFEBcDKO and control mice over the 24‐h cycle (n = 3 per group/time point). ZT21 is double‐plotted for visualization. Data are presented as mean ± SEM (two‐way ANOVA test (interaction/time/group) followed by the Bonferroni post hoc test: ns non‐significant; *P ≤ 0.05; **P < 0.01; ***P < 0.001; ****P < 0.0001).
-
BRepresentative activity records (actograms) of mice of the indicated genotypes under normal light:dark cycles 14:10 (LD) or constant darkness (DD). Data were plotted in duplicate columns in each panel.
-
C, DQuantification of the overall activity during the LD period of mice at the indicated genotypes (n = 6–9 per group). Data are presented as mean ± SEM. (two‐way ANOVA test followed by the Bonferroni post hoc test: **P < 0.01; ***P < 0.001; ****P < 0.0001).
