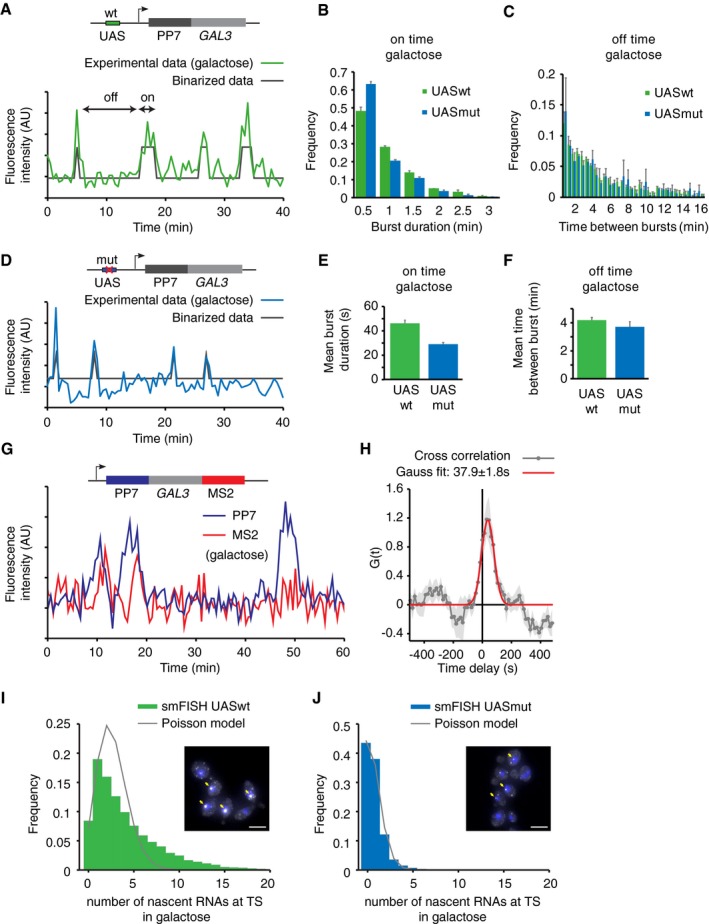
Figure 1. Mutations in upstream activating sequence (UAS) reduce burst size, but not burst frequency.

- Transcription at GAL3 is visualized by addition of PP7 loops at the 5′ of GAL3 in budding yeast. Example trace of the quantified fluorescence intensity of the transcription site. Traces are binarized to determine on (active) and off (inactive) times.
- Histogram of GAL3 on time (burst duration) for cells with wt and mutated UAS, respectively, reveals shorter on times for mutated UAS. Errors indicate SE of three experiments, n = 324 cells UASwt, n = 250 cells UASmut.
- Histogram of GAL3 off times. Errors indicate SE of three experiments.
- Similar to (A) for cells were the UAS was mutated to a lower affinity UAS. Also see Fig EV1.
- Average on time for UASwt and UASmut from exponential fit. Errors indicate SD of fit.
- Average off time for UASwt and UASmut from exponential fit. Errors indicate SD of fit.
- Example traces of quantified fluorescence intensity at the transcription site for 5′PP7 and 3′MS2 at GAL3.
- Cross‐correlation of the PP7 and MS2 signals shows a peak at 37.9 s ± 1.8 s delay, n = 137 cells. Shaded area and errors indicate SEM.
- Distribution of number of nascent RNAs at the transcription site determined by smFISH. The distribution of UASwt does not fit a Poisson distribution (gray line), supporting that GAL3 is not constitutively transcribed, but is transcribed in bursts. Example image is shown, and yellow arrows indicate TSs. Scale bars: 5 μm. n = 11,839 cells.
- Same as (G) for cells with UASmut. The distribution of UASmut fits a Poisson distribution, indicating that GAL3‐UASmut is transcribed with random initiation of individual polymerases, similar to constitutive genes. n = 10,616 cells. See also Fig EV1B and C.
Source data are available online for this figure.
