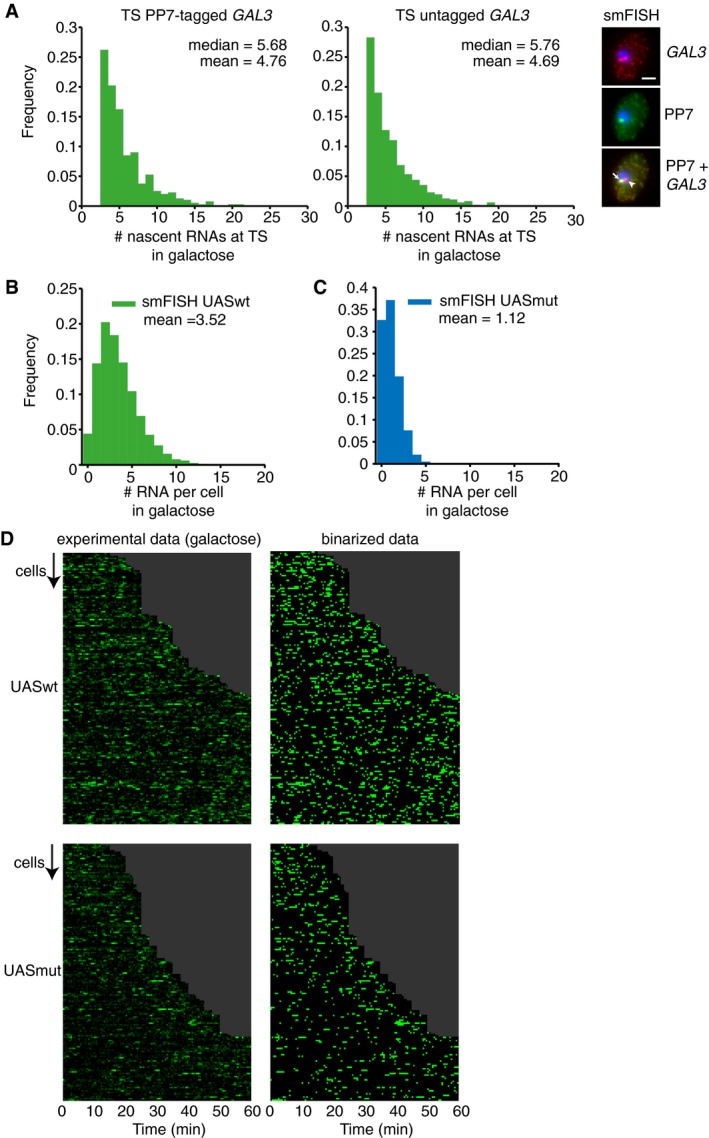
Figure EV1. Mutations in upstream activating sequence reduce burst size, but not burst frequency (related to Fig 1).

- GAL3 transcription site intensity of heterozygous diploids with and untagged and PP7‐tagged GAL3 allele, as measured by colocalization with the PP7 TS with smFISH. An example cell is shown on the right, with the PP7‐tagged GAL3 allele indicated with an arrow and the untagged allele indicated with an arrowhead. The dynamic range and distribution of the tagged and untagged allele are similar, indicating that the PP7‐tag does not affect transcription of GAL3. To prevent single RNAs from contributing to the TS distributions, TSs were defined as nuclear spots with 2.5‐fold the median intensity of cytoplasmic RNAs. n = 2,716 cells. Scale bar: 2 μm.
- Distribution of the number of RNAs per cell determined by smFISH. A strain with PP7‐tagged GAL3 driven by the UASwt GAL3 promoter was hybridized with PP7 probes. n = 11,839 cells.
- Same as (B) for a strain with UASmut GAL3 promoter. n = 4,845 cells.
- Heatmap of transcription site intensity of individual cells (rows) in galactose of one of three independent experiments. Left plots show experimental data for UASwt and UASmut at GAL3, right plots show binarized data after thresholding. In all three experiments combined, 324 cells were analyzed for UASwt and 250 cells for UASmut.
