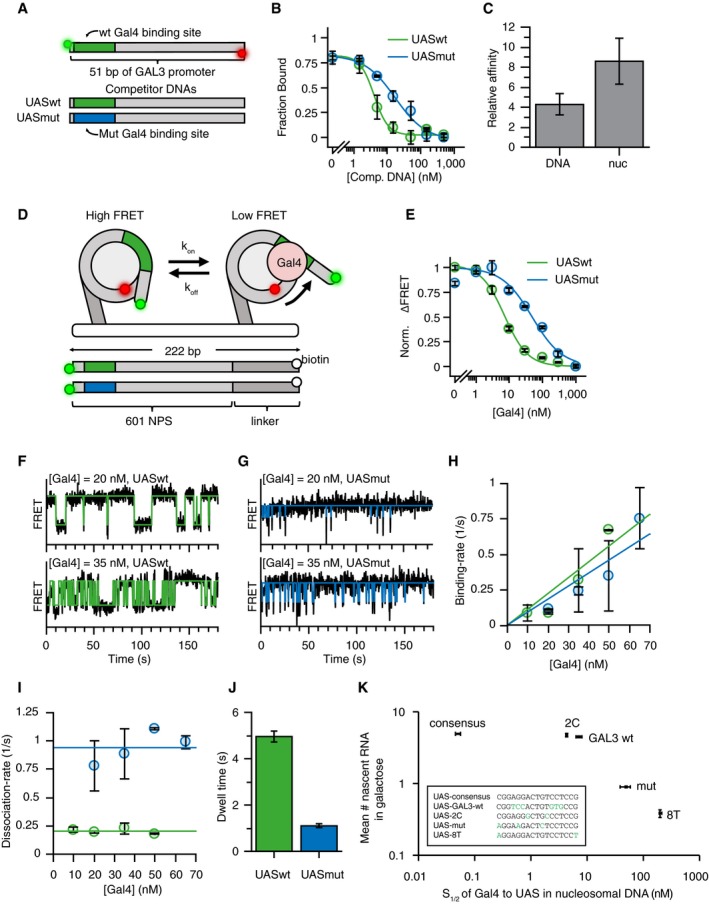
Figure 2. Mutations in UAS reduce residence time of Gal4 on nucleosomal DNA in vitro .

- Competitive binding experiments were performed to determine relative affinity of Gal4 to UASwt (green) and UASmut (blue) motifs. Gal4 occupancy on UASwt Cy3/Cy5 DNA was determined by measuring protein‐induced fluorescence enhancement (PIFE) on 51‐bp oligos containing either Gal4 UASwt or UASmut site 1 bp away from Cy3 fluorophore).
- Titrating unlabeled UASwt or UASmut competitor DNA reduces UASwt Cy3/Cy5 DNA occupancy. IC50UASwt = 4.0 ± 0.6 nM, IC50UASmut = 17.3 ± 3.5 nM. n = 3. Error bars indicate SD.
- Comparison between relative affinities of Gal4 UASwt versus UASmut in naked or nucleosomal DNA shows 4.3 ± 1.1 × difference in K D from naked DNA and 6.8 ± 1.7× from nucleosomal DNA. n = 3. Error bars indicate SD.
- Experimental setup for smFRET experiments to measure Gal4 binding at nucleosomal DNA. Gal4 binds to site 8 bp into nucleosome. A FRET pair in the entry/exit region provides readout on binding events (one fluorophore on DNA, one on histone). In the absence of Gal4, nucleosomes are in the high FRET state. A Gal4 binding event traps nucleosome in low FRET state.
- Gal4 affinity to nucleosomes containing UASwt or UASmut sequences gives S1/2 of 7.2 ± 0.8 nM and 48.9 ± 10.8 nM, respectively. n = 3. Error bars indicate SD.
- Example smFRET traces showing Gal4 binding to UASwt in nucleosomal DNA at two different Gal4 concentrations. States are determined using HMM fit.
- Same as (F) but for UASmut.
- Binding rates of Gal4 are concentration‐dependent, but are similar for UASwt and UASmut: kon UASwt = 0.011 ± 0.002/s/nM, kon UASmut = 0.009 ± 0.001/s/nM. n = 2 for all, except n = 4 for UASwt 10 nM Gal4 and n = 3 for UASwt 20 nM Gal4. Error bars indicate SD.
- The dissociation rate of Gal4 at UASwt is ˜5‐fold slower compared to the UASmut: koff UASwt = 0.20 ± 0.01/s, koff UASmut = 0.92 ± 0.05/s. n = 2 for all, except n = 4 for UASwt 10 nM Gal4 and n = 3 for UASwt 20 nM Gal4. Error bars indicate SD.
- Histogram of Gal4 dwell time to nucleosomal DNA containing UASwt and UASmut sequences. n = 11 for UASwt, n = 8 for UASmut. Error bars indicate SE.
- Scatter plot showing the average number of nascent RNA at TS (from smFISH) versus affinity of Gal4 to different UAS sequences in nucleosomal DNA (from in vitro measurements). In vivo transcription levels correlate with in vitro affinity of Gal4, but transcription saturates above wild‐type sequence. UAS sequences are shown in the box. For mean number of nascent RNA from smFISH, n = 2 for UASconsensus, UAS‐2C, UAS‐8T and n = 8 for UASwt, UASmut and errors indicate SEM. For in vitro affinity measurements, n = 3 and errors indicate SD.
Source data are available online for this figure.
