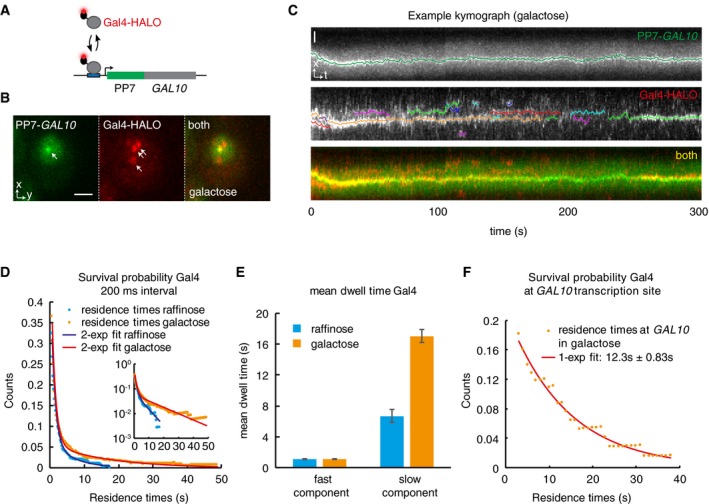
Figure 4. Measurements of the Gal4 residence time in vivo shows two Gal4 populations, with long residence times colocalizing with target gene.

- Simultaneous imaging of Gal4 binding kinetics in vivo using single‐molecule tracking and RNA imaging of the GAL10 target gene. Gal4 is tagged with a HALO tag, which covalently binds to the dye JF646. Transcription of the target gene GAL10 is visualized by PP7 loops.
- Example image of a cell, showing the GAL10 TS (arrow, left panel), single molecules of Gal4 (arrows, middle panel), and an overlay (right panel). Scale bar: 2 μm.
- Example kymograph of a cell. Upper panel (PP7‐GAL10) shows the position of the TS over time. Middle panel (Gal4‐HALO) show tracks of Gal4. Data are in white, colored lines show analyzed tracks. Lower panel shows overlay, showing colocalization of some the Gal4 tracks to the GAL10 TS. Scale bar: 1 μm.
- Survival probability of the duration of Gal4 tracks (after displacement thresholding) at 200 ms interval from cells grown in raffinose (n = 258 tracks in 30 cells) or galactose (n = 346 tracks in 25 cells). Lines show bi‐exponential fit, indicating 2 Gal4 populations. Inset shows data in semi‐logarithmic plot.
- Residence time of the fast and slow components of the fits from (D). The slow component changes between conditions. Error bars indicate 95% CI.
- Survival probability of Gal4 residence times that colocalize with GAL10 TS (< 250 nm), showing that Gal4 with long residence time colocalizes with GAL10. Data were taken at 1s interval and show overlap between 267 Gal4 tracks and 83 GAL10 tracks, representing 458 bound molecules. Line shows exponential fit, with mean of 12.3 s ± 0.83 s. Errors indicate 95% CI.
Source data are available online for this figure.
