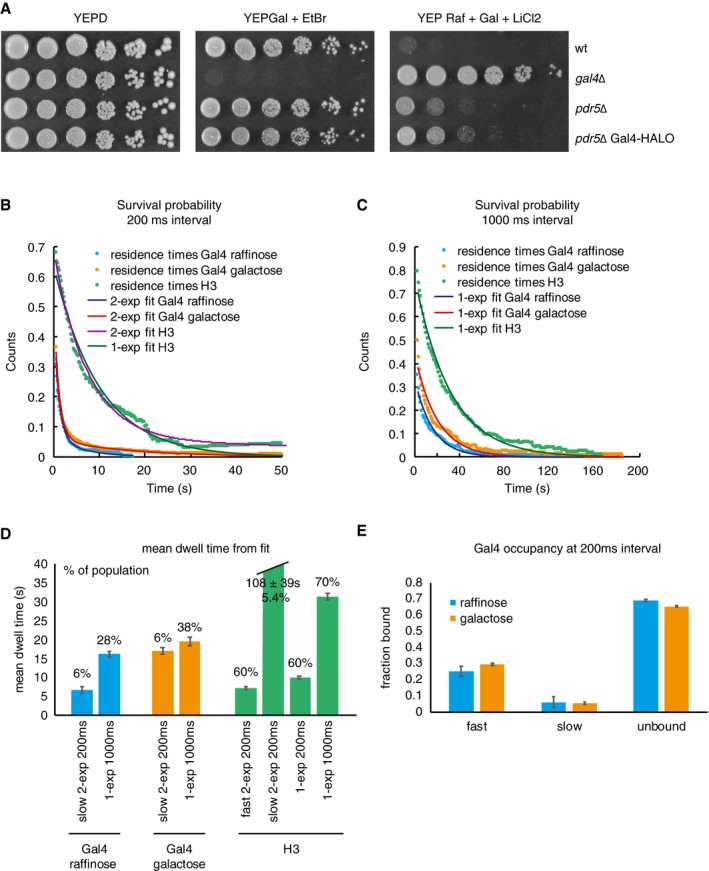
Growth assay of wt, gal4∆, pdr5∆ and pdr5∆ Gal4‐HALO strains. Serial dilutions (fivefold) are shown after 3 days of growth on YEPD, YEPGal + EtBr, and YEP Raf + Gal + LiCl2.
Survival probability of the duration of Gal4 and H3 tracks (after displacement thresholding) at 200 ms interval from cells grown in raffinose or galactose. H3 is fit by a single and bi‐exponential, Gal4 by a bi‐exponential distribution, indicating 2 Gal4 populations. Gal4 raffinose: n = 258 tracks in 30 cells, Gal4 galactose: n = 346 tracks in 25 cells, H3: n = 175 tracks in 34 cells.
Same as for (A) at 1,000 ms interval. Both H3 and Gal4 are fit to a single‐exponential fit. Gal4 raffinose: n = 153 tracks in 41 cells, Gal4 galactose: n = 238 tracks in 40 cells, H3: 213 tracks in 43 cells.
Comparison of the mean residence times from data taken at 200 and 1,000 ms interval. The percentages above indicate the percentage of the population that the bar represents. H3 is a control, and is used to determine the longest measurable dwell time in our assay before we have bleaching effects. Although at 200 ms the 2‐exp fit of H3 shows that 5% of the molecules have a long dwell time of 108 s, the majority of H3 (60%) show a residence time of 7 s that is similar to Gal4. As expected, the average H3 dwell time (from 1‐exp fit) increases from 9.9 s at 200 ms to 31.2 s at 1,000 ms interval, indicating it is dominated by bleaching. Gal4 dwell time does not show the same increase between 200 and 1,000 ms interval, indicating that we are capturing the real dwell time. At 1,000 ms, we are well below the average dwell time of H3. Gal4 raffinose 200 ms: n = 258 tracks in 30 cells, Gal4 raffinose 1,000 ms: n = 153 tracks in 41 cells, Gal4 galactose 200 ms: n = 346 tracks in 25 cells, Gal4 galactose 1,000 ms: n = 238 tracks in 40 cells, H3 200 ms: n = 175 tracks in 34 cells, H3 1,000 ms: 213 tracks in 43 cells. Error bars indicate 95% CI.
The fraction of fast‐ and slow‐bound Gal4 molecules is similar in raffinose and galactose. Gal4 raffinose: n = 258 tracks in 30 cells, Gal4 galactose: n = 346 tracks in 25 cells. Error bars indicate SD.

