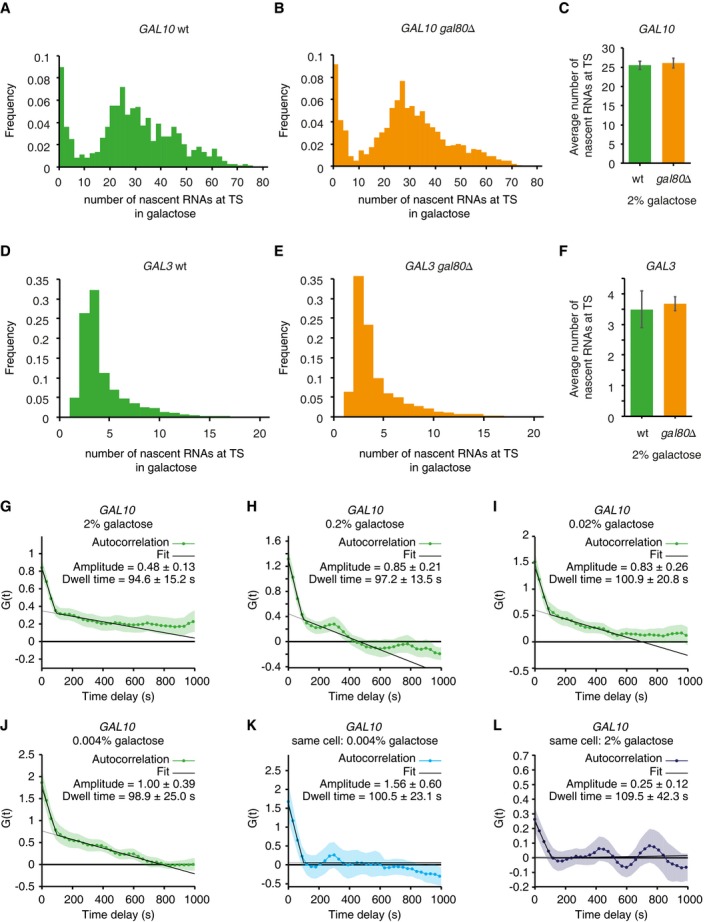
Figure EV5. Galactose signaling regulates transcription levels by modulating burst frequency but not burst duration (related to Fig 6).

-
ADistribution of number of nascent RNAs at the GAL10 transcription site determined by smFISH in wild‐type cells grown in galactose.
-
BSame as (A) for gal80Δ cells.
-
CAverage number of nascent RNA at the GAL10 transcription site, determined by 8 smFISH experiments as in (A) for wt (n = 23,503 cells) and 4 experiments as in (B) for gal80Δ (n = 6,472 cells). Error bars indicate SEM.
-
DDistribution of number of nascent RNAs at the GAL3 transcription site determined by smFISH in wild‐type cells grown in galactose.
-
ESame as (D) for gal80Δ cells.
-
FAverage number of nascent RNA at the GAL3 transcription site, as determined by 3 smFISH experiments as in (D) for wt (n = 12,410 cells) and 4 experiments as in (E) for gal80Δ (n = 29,022 cells). Error bars indicate SEM.
-
G–JAutocorrelation of GAL10 TS intensity traces from cells after induction with media containing (G) 2% galactose, n = 86 cells (H) 0.2% galactose, n = 79 cells (I) 0.02% galactose, n = 84 cells (J) 0.004% galactose, n = 53 cells, corrected for non‐steady state effects (Lenstra et al, 2015). Dwell times and amplitudes are represented as bar graphs in Fig 6D and E. Shaded areas and errors indicate SEM.
-
K, LAutocorrelation of same‐cell dose response of GAL10 TS intensity traces from cells grown in (K) 0.004% galactose, and (L) after addition of 2% galactose (n = 13 cells), corrected for non‐steady state effects (Lenstra et al, 2015). Dwell times and amplitudes are represented as bar graphs in Fig 6G and H. Shaded areas and errors indicate SEM.
