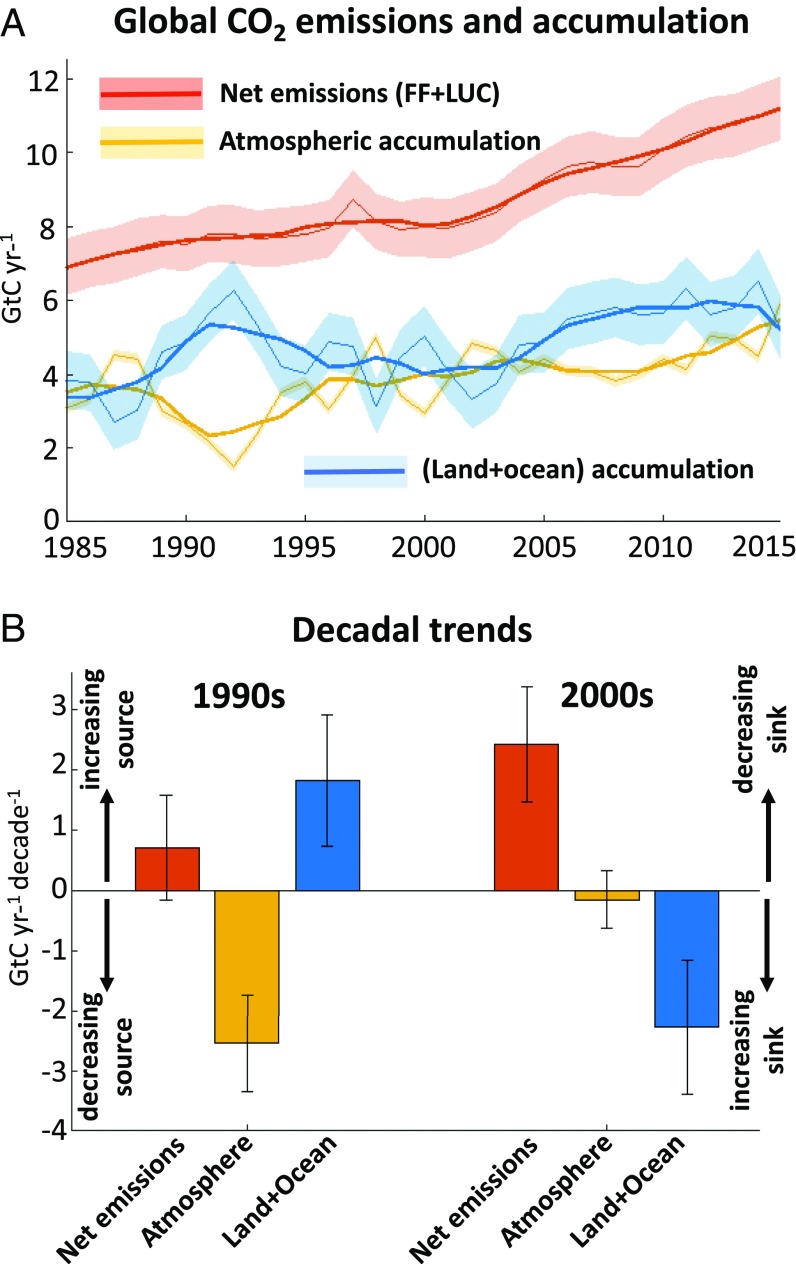
Fig. 1.
(A) Global emissions from fossil-fuel-burning, cement production, and land-use change (FF+LUC) (red curve), compared with the measured rate of accumulation of in the atmosphere (gold curve) and the inferred rate of change of accumulation in the land and ocean (blue curve). Thin lines are annual means, and thick lines are 5-y running means. (B) Decadal trends in emissions (FF+LUC) and the atmospheric and total land+ocean sinks. For emissions, positive values indicate an increasing source and negative values a decreasing source (left-hand arrows; sign convention as in Eq. 1). For the atmosphere and land+ocean sinks, positive values indicate a decreasing sink and negative values an increasing sink (right-hand arrows; opposite the sign convention in Eq. 1). All data are from the 2017 Global Carbon Budget (3, 4). Error bars are 1-.

