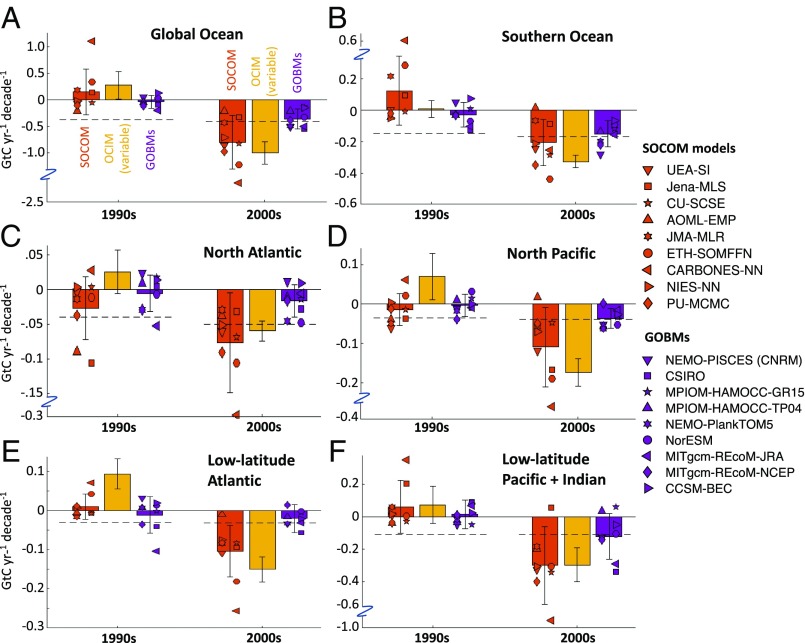
Fig. 3.
Decadal trends in ocean carbon uptake for the global ocean (A) and for different ocean regions (B–F) as defined by the biomes of refs. 25 and 26 (see SI Appendix for biome definitions and definitions of the models used here). (B) Southern Ocean. (C) North Atlantic. (D) North Pacific. (E) Low-latitude Atlantic. (F) Low-latitude Pacific + Indian. The global ocean in A is the sum of the regions in B–F and does not include coastal regions and marginal seas. Trends and color-coding are as in Fig. 2B, with symbols representing individual models. Positive trends represent a weakening oceanic sink and negative trends a strengthening oceanic sink.

