
Figure 3. Selective and reversible manipulation of CCSP and SPC co‐expressing BASCs by split‐tTA effectors.
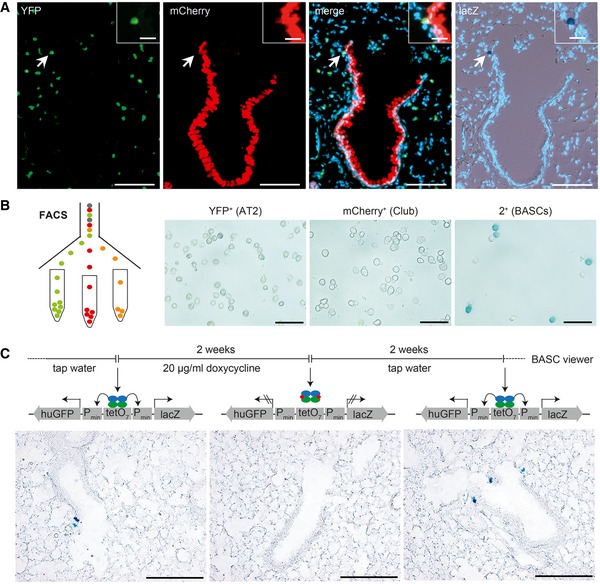
- Sequential microscopic imaging of epifluorescence and β‐galactosidase activity in lung sections of adult BASC viewer animals. Arrow highlights labeled BASC at BADJ (magnified in box). Blue: DAPI. Scale bars: 100 μm (overview) and 20 μm (boxed magnification).
- β‐galactosidase staining of AT2 cells (YFP+), Club cells (mCherry+), and BASCs (mCherry+/YFP+) isolated from BASC viewer mice by fluorescence‐activated cell sorting (FACS). Scale bar: 50 μm.
- Doxycycline‐dependent reversible labeling of BASCs in BASC viewer mice. Scale bar: 200 μm.