
Figure EV3. Isolation of AT2 cells, Club cells, and BASCs by FACS .
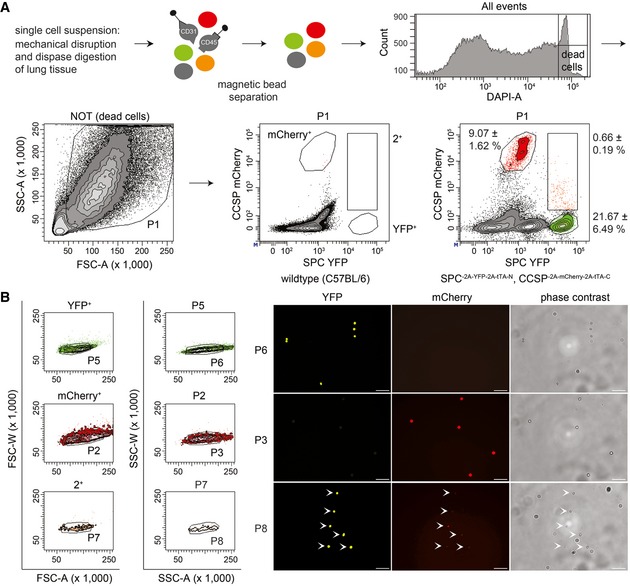
- Hematopoietic and endothelial cells were separated from lung cell suspensions using magnetic beads (anti‐CD45 and anti‐CD31). Viable epithelial cells were analyzed for mCherry and YFP fluorescence to establish the gates for mCherry+ (Club cells), YFP+ (AT2 cells), and 2+ (BASCs). Cell abundance is shown as percentage of total P1 cells. Data depicted as mean ± SD, n = 10.
- Doublet exclusion based on forward (FSC) and side scatter (SSC) width versus amplitude plots and subsequent fluorescence microscopy of FACS‐isolated single cells. Scale bar: 50 μm.
Source data are available online for this figure.