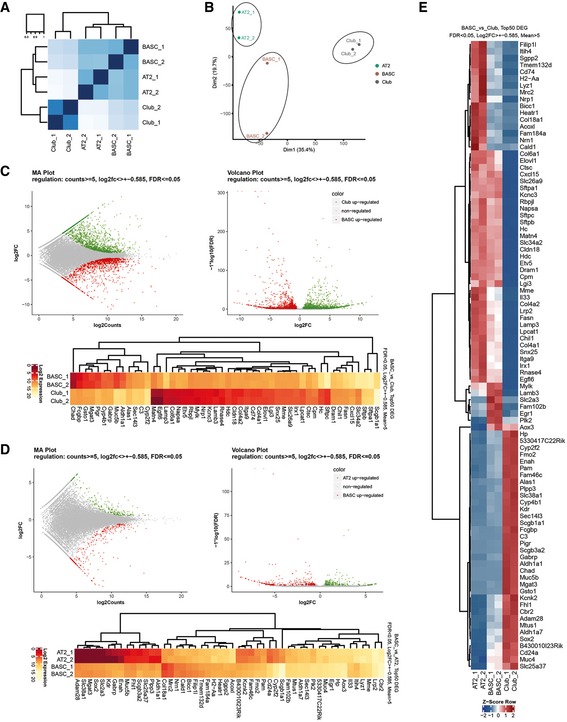
Heatmaps for Spearman correlation.
Principal component analysis reveals distinct clustering of AT2, Club, and BASC populations.
MA and volcano plots, and Top50 DEGs (FDR < 0.05, Log2FC > ± 0.585, Means > 5) for visualization of pairwise differential gene expression analysis of BASCs and Club cells.
MA and volcano plots, and Top50 DEGs (FDR < 0.05, Log2FC > ± 0.585, Means > 5) for visualization of pairwise differential gene expression analysis of BASCs and AT2 cells.
Heatmap of RNA‐seq z‐scores computed for the Top50 DEGs in BASC, AT2 and Club cells (FDR < 0.05, Log2FC > ± 0.585, Means > 5).