
Figure 8. BASCs are a main cellular source for distal airway regeneration.
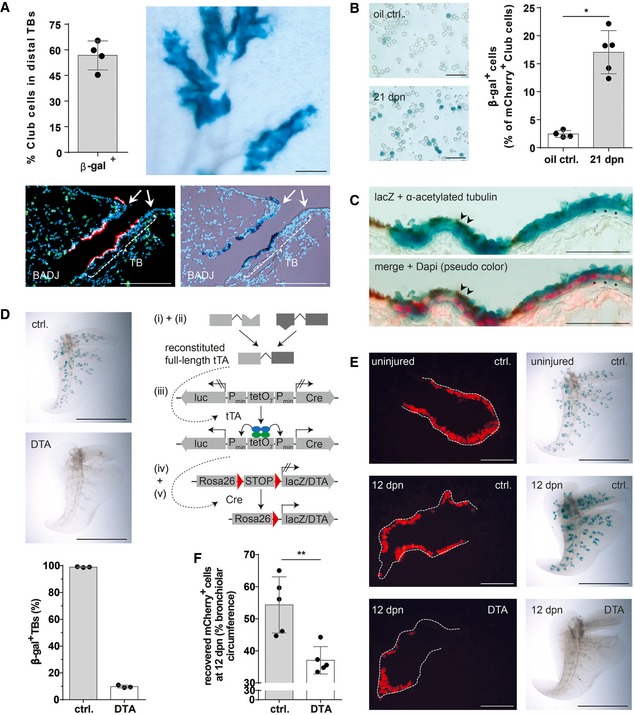
- Quantification of lineage‐traced Club cells in distal TBs and β‐galactosidase staining of cleared accessory lobe preparation (scale bar: 250 μm) isolated from injured BASC v‐race mice at 21 dpn (mean ± SD, n = 4). Bottom panel: example of sequential microscopic imaging to quantify β‐gal+ mCherry+ cells in distal TBs. Arrows denote last airway bifurcation before bronchioalveolar duct junction (BADJ). Scale bar: 200 μm.
- β‐galactosidase staining of FACS‐purified Club cells from control and injured BASC v‐race animals. Scale bar: 50 μm. The percentage of lineage‐traced Club cells is shown [(mean ± SD, n = 4 (oil ctrl.) or n = 5 (21 dpn), * P = 0.0159 (Mann–Whitney test)].
- Combined β‐galactosidase (blue) and acetylated tubulin staining (cilia, brown color) of lung sections from BASC v‐race animals at 21 dpn. Red: DAPI (pseudocolor). Examples of lineage‐traced ciliated cells (arrowheads) and Club cells (asterisks) are highlighted. Scale bar: 50 μm.
- β‐galactosidase staining of cleared accessory lobe preparations (scale bar: 5 mm) and quantification of β‐gal+ bronchioles in lung sections from adult BASC v‐race (ctrl.) and BASC‐ablated mice (DTA). Data depicted as mean ± SD, n = 3.
- β‐galactosidase staining of cleared accessory lobe preparations (scale bar: 5 mm) and fluorescence microscopy of lung sections from uninjured and naphthalene‐exposed BASC v‐race (ctrl.) and BASC‐ablated (DTA) mice 12 days post‐naphthalene (dpn). Dotted lines depict bronchiolar boundaries. Scale bar: 100 μm.
- Quantification of Club cell recovery in injured BASC v‐race (ctrl.) and BASC‐ablated (DTA) animals, expressed as percentage of bronchiolar circumference re‐populated by mCherry+ cells at 12 dpn. Data depicted as mean ± SD, n = 5, **P = 0.0079 (Mann–Whitney test). DTA, diphtheria toxin fragment A.
Source data are available online for this figure.