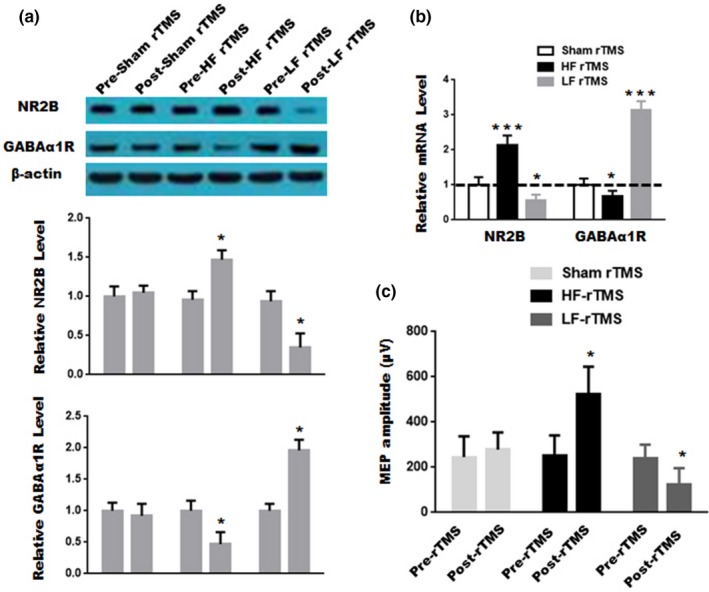
Figure 3.

Verification of effectiveness of restraint devices. (a) The proteins were analyzed from the mouse frontal cortex in the sham rTMS group, the high frequency rTMS group and the low frequency rTMS group before stimulation (pre‐rTMS) and after stimulation (post‐rTMS). Data are presented as mean ± SD (n = 3 for each group). Upper panel, representative blots; Middle and Lower panel, quantitative analysis for NR2B subunit and GABAα1R expression, respectively.; *p < 0.05, compared to pre‐rTMS. (b) The expression of NR2B mRNA, GABAα1R mRNA and β‐actin mRNA were analyzed from the sham rTMS group, the high frequency rTMS group and the low frequency rTMS group. Data are presented as mean ± SD (n = 3 for each group). *p < 0.05, ***p < 0.001, compared to pre‐rTMS. (c) MEPs were detected before stimulation and after stimulation in anesthetized rats from the sham rTMS group, the high frequency rTMS group and the low frequency rTMS group. Data are presented as mean ± SD (n = 6 for each group). *p < 0.05, compared to pre‐rTMS. Values in real stimulation group were normalized to that in sham stimulation, and student's t test was used
