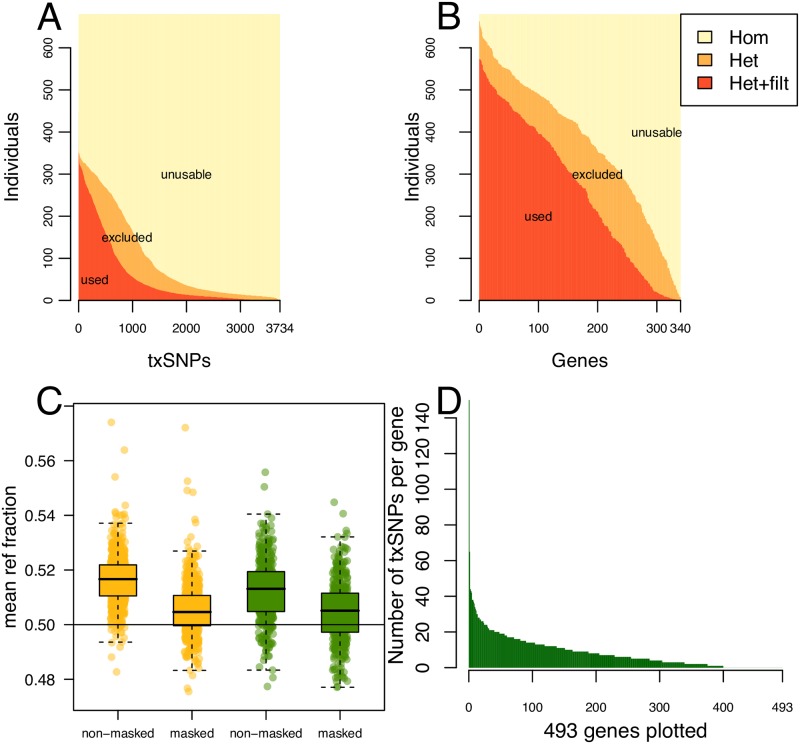
Fig 2. Filtration and mapping bias considerations in analysis pipeline.
(A) Shows the least amount of individuals (Y-axis) for a given amount of txSNPs (X-axis) at different condition levels, namely Het, i.e. count of heterozygous SNPs, Het+filt, i.e. the count of heterozygous SNPs that pass QC filtration, and Hom, i.e. the remaining SNPs, which are homozygous. (B) Similar, but instead with an X-axis showing gene-count for which at least one txSNP fulfills the condition level. In other words, the number analyzable individuals for a given amount of the genes of interest. (C) The fraction of reference-allele containing reads measured over all txSNPs, dependent on using a masked or a non-masked genome. The horizontal line at 0.5 indicates the expected fraction under the assumption of no mapping bias. Yellow indicates DLPFC tissue, green indicates Hippocampus tissue. (D) Number of txSNPs in the genes of interest with at least one heterozygote sample among the 782 analyzed individuals.

