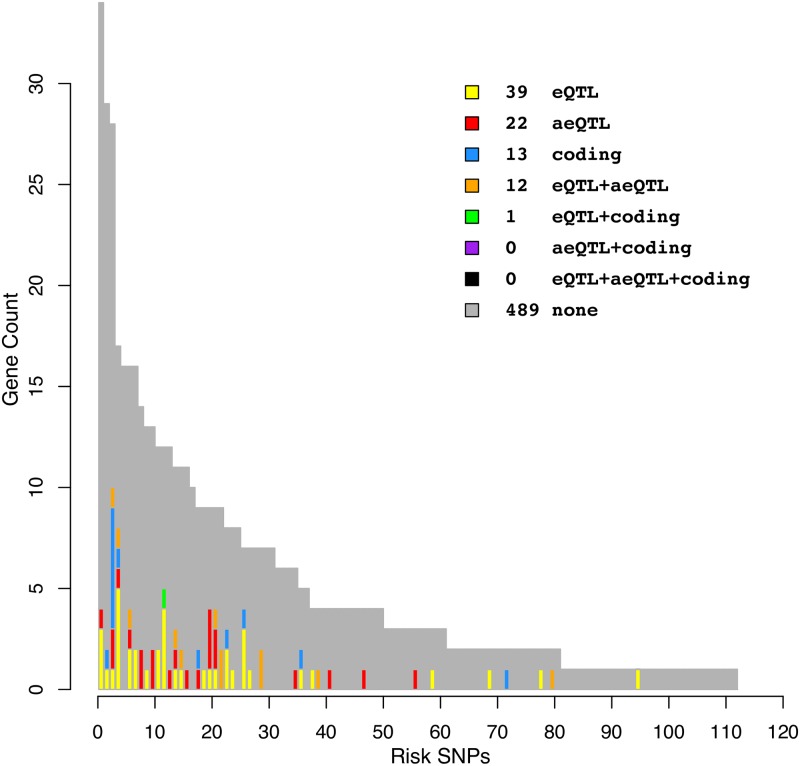
Fig 4. Overview comparing gene-level eQTL and aeQTL findings for the SZ risk-SNPs under analysis.
Each bar corresponds to a single risk-SNP and the height of the bar shows the number of genes within 200kb. The color code indicates which of these genes have mechanistic evidence, either from previous or current work. Mechanistic evidence is here defined as either missense SNPs in proxy with the GWAS risk SNPs, gene-level eQTL effects, or aeQTL effects. Note that all 124 risk-SNPs in the 108 loci are shown, including 13 risk-SNPs with no genes within 200kb.

