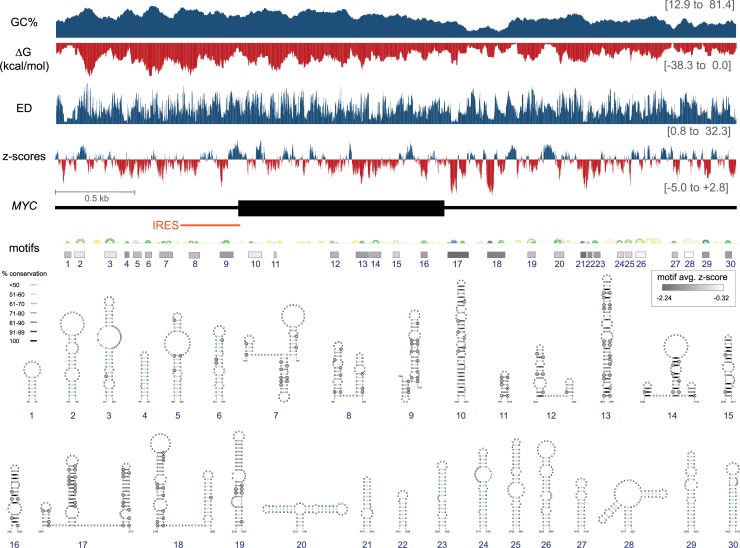
Fig 1. Summary of ScanFold-Scan and ScanFold-Fold results for the MYC mRNA.
At the top are charts indicating the predicted ScanFold-Scan metrics across the mRNA. The bars are set at the 1st nt of the 70 nt window, thus data corresponds to the 70 nt downstream of the bar. On the right, in brackets, the maximal and minimal values of each predicted metric for windows spanning the MYC mRNA are given. Below these charts is a cartoon of the MYC mRNA with UTRs and coding region represented in thin and thick black lines, respectively. This cartoon is annotated with boxes which depict the location and extent of ScanFold-Fold predicted motifs shaded based on the average z-score of windows in which motif base pairs occurred. Above these are RNA secondary structure arc diagrams which depict the most favorable base pairs predicted via ScanFold-Fold, colored according to the average z-scores of windows in which they appear (with blue, green and yellow corresponding to less than -2, -1 and 0 z-score averages respectively). Below these, are refolded models of the motifs built with -1 average z-score bp as constraints. Each is annotated with their bp conservation as determined from an alignment of 15 representative mRNAs (S3 File) indicated by shading on the base pair (see key). Circled bases are sites of putative structure-preserving consistent and compensatory mutations.

