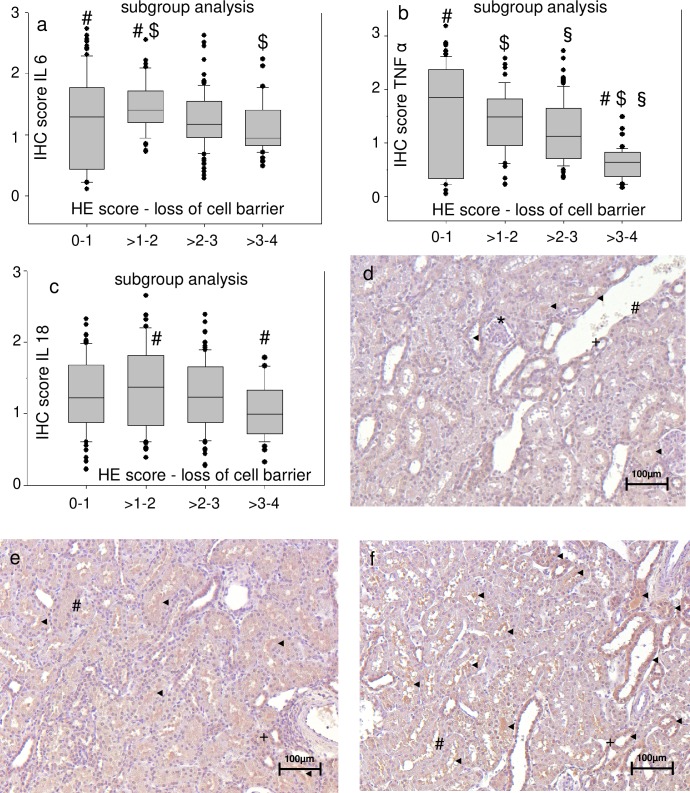
Fig 6. Kidney cell damage is not accompanied by high tissue levels of proinflammatory molecules independently of the score criteria that is investigated.
Subgroup analysis (a, b, c) compares pooled subgroups for the semiquantitative score for loss of cell barrier in hematoxylin eosin (HE) stained slices with the highest/lowest scores for the respective immunohistochemical markers in immunohistochemical (IHC) stained slices at 400:1 enlargement. The values are presented as boxplots (median/25th/75th percentile/ outliers). Pairs of symbols mark p < 0.05. Photos (d, e, f) display kidney slices stained for IL 18 (all 200:1 enlargement) with d. little staining for IL 18 (IHC score 1), e. medium staining for IL 18 (IHC score 2), extensive staining for IL 18 (IHC score 3–4). * mark renal corpuscles, # mark proximal tubules, + mark distal tubules, ◄ mark staining for IL 18 (strained brown).

