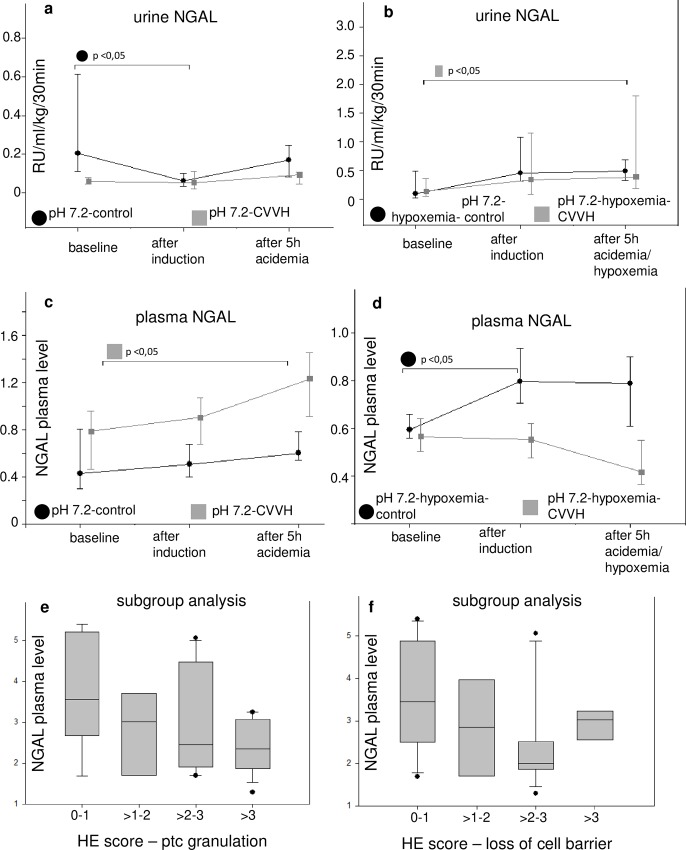
Fig 9. Histopathology, urine NGAL and plasma NGAL.
The serum or urine concentrations of neutrophil gelatin-associated lipocalin (NGAL) are depicted in a-d. The values are presented as scatter plots (median/25th/75th percentile). The respective subgroup analysis (e, f) compare pooled subgroups for the semiquantative score for proximal tubular cell (PTC) granulation (a) and loss of cell barrier (b) in hematoxylin eosin (HE) stained slices at 400:1 enlargement with serum NGAL concentrations. The abbreviations pH 7.4-control. etc. mark the experimental groups as described in the article. Bracelets mark p < 0.0.5.

