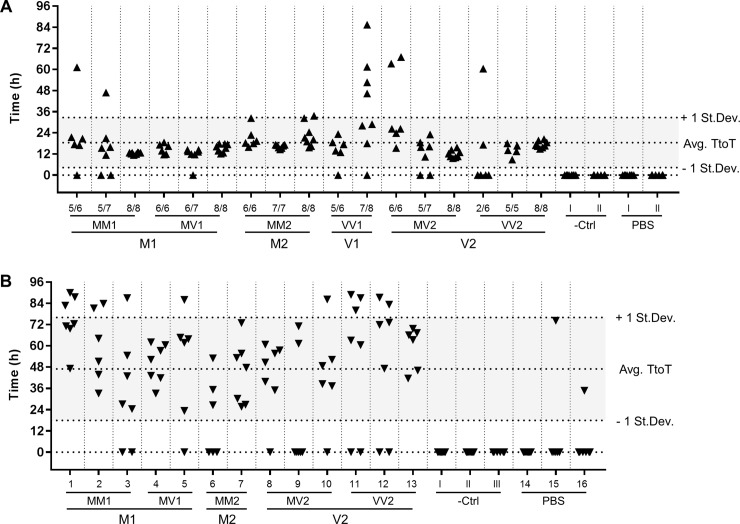
Fig 2. Graphical summary of the RT-QuIC reactions results.
Each data point represents the time (in hours) at which an individual reaction well reached the threshold of fluorescence for positivity (Time to Threshold, TtoT). Technical replicates per individual seed are displayed in columns. Dashed lines mark the average TtoT +/- one standard deviation. (A) 10%BH seeded RT-QuIC (B) CSF seeded RT-QuIC. In both instances no subtype specific trend is observed.

