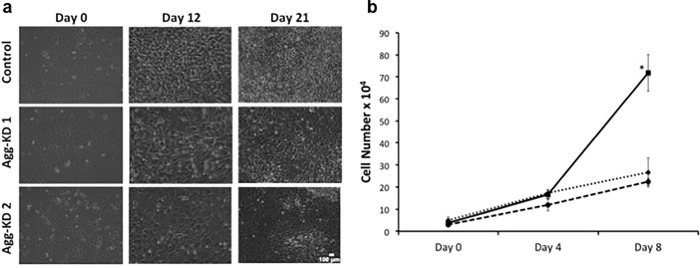
Fig 5.
(a) Phase contrast photomicrographs of ITS-stimulated ATDC5 cells on days 0, 12 and 21 in culture. Images were acquired at 10x magnification. Scale bar in the bottom right corner depicts 100 micrometers. (b) Hemocytometer counts of ITS-stimulated controls cells (solid line) and aggrecan knockdown cells AggKD1 (dashed line) and AggKD2 (dotted line) on days 0, 4 and 8. Data are shown as the mean +1 SD for 3 biological replicates per condition. *, p<0.0005 versus both aggrecan knockdown cell lines.

