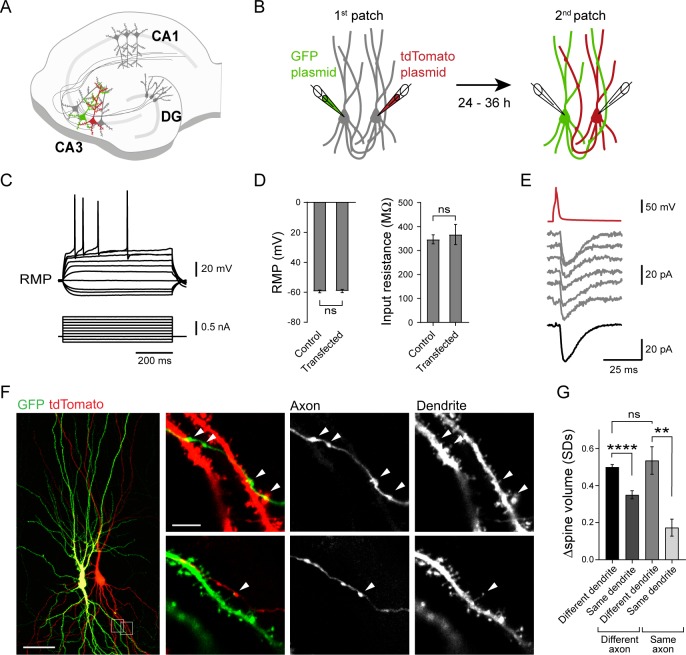
Fig 6. Spine head volume of CA3 cells segregate depending on dendritic branches and, locally, on presynaptic CA3 inputs.
(A) Scheme illustrating a single pair of CA3 pyramidal cells from an organotypic slice that have been transfected to express GFP and tdTomato. (B) Experimental strategy to express different fluorescent proteins in a pair of CA3 cells. Whole-cell recordings are used to ensure the functional connectivity between the two cells and to infuse plasmids encoding GFP and tdTomato, allowing for visualization and discrimination of their axons and dendrites 24–36 h later. (C) Traces showing current-voltage relationship from a transfected CA3 pyramidal cell (100 pA current injection steps for 600 ms, from -200 pA to +700 pA). (D) Summary of RMP and Ri of transfected cells and control cells in same recording conditions (transfected: n = 10 cells, control n = 20 cells, Mann–Whitney test). (E) Example traces recorded from a connected CA3 cell pair showing synaptic currents (gray traces) evoked in response to an AP (red trace) triggered in the presynaptic cell 24–36 h after the transfection (second patch). The thick black trace at the bottom represents the average EPSC trace. (F) Confocal images acquired with a scanning laser microscope showing morphological interactions between CA3 neurons from a slice fixed 24–36 h after transfection. Left panel shows low magnification image of the 2D projection of a confocal stack. Right panels show high magnification views of the morphological contacts (arrowheads) between axonal boutons and dendritic spines from the CA3 neurons expressing GFP or tdTomato. Scale bar: Left panel, 50 μm; right panels, 5 μm. (G) Summary graph showing the spine head volume difference for pairs of spines apposed to different or same axon and belonging to different or same dendritic segments (n = 318 spines from 5 pairs, Kruskall–Wallis test followed by Dunn multiple comparison test, *p < 0.05, ****p < 0.0001). Underlying data can be found in S1 Data. AP, action potential; CA3, Cornu Ammonis 3; DG, dentate gyrus; EPSC, excitatory postsynaptic current; GFP, green fluorescent protein; ns, not significant; Ri, input resistance; RMP, resting membrane potential.

