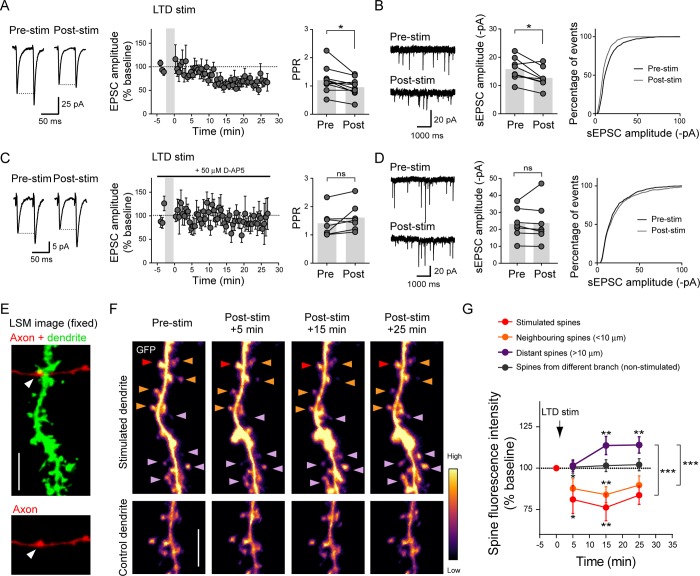
Fig 7. LTD induction at unitary CA3 recurrent connections triggers functional and structural plasticity at both stimulated and nonstimulated synapses.
(A,C) Left: representative traces showing synaptic currents in the postsynaptic CA3 neuron evoked by a pair of APs triggered in the presynaptic CA3 neuron (2–3 nA, 50-ms interval), before and 20 min after LTD induction in absence (A) or presence (C) of 50 μM D-AP5. Middle: summary of the time course of EPSC amplitude (n = 10 cell pairs) for untreated (A) and D-AP5 (C). The gray shaded box represents the LTD induction. Right: graph plots showing PPR values before and after LTD induction in absence (A) or presence (C) of D-AP5 (untreated: n = 10 cell pairs; D-AP5: n = 7 cell pairs; paired two-tailed Student t test, *p < 0.05). (B,D) Left: example traces of sEPSCs recorded before (Pre-stim) and after (Post-stim) LTD induction in absence (B) or presence (D) of 50 μM D-AP5. Middle: graph plots showing sEPSC amplitude before and after LTD induction in absence (B) or presence (D) of D-AP5 (untreated: n = 9 cell pairs, D-AP5: n = 7 cell pairs, paired two-tailed Student t test, *p < 0.05). Right: cumulative distributions of sEPSC amplitudes before and after LTD induction in absence (B) or presence (D) of D-AP5. (E) 2D projection of optical sections acquired with an LSM from a slice fixed after the live-imaging session. The image shows a dendritic segment (green) with a spine apposed to a presynaptic terminal (arrowhead) of the labeled presynaptic CA3 cell axon (red). Scale bar, 5 μm. (F) 2D projections of time-lapse spinning disk confocal images acquired before (Pre-stim) and 5 min, 15 min, or 25 min after LTD induction and whose fluorescence intensity is color-coded. Images on the top show the same dendritic segment as in (E). The stimulated spine, the neighboring spines, and the distal spines are indicated with red, orange, and purple arrowheads, respectively. The image on the bottom shows a segment of dendrite with no spines contacted by the axon (control dendrite). Scale bar, 5 μm. (G) Time course of spine fluorescence integrated intensity normalized to the baseline for corresponding spines (stimulated, n = 9 spines from 4 slices; neighboring, 26 spines from 4 slices; distant, n = 28 spines from 4 slices; nonstimulated dendrite, n = 27 spines from 4 slices; two-way ANOVA test followed by Tukey and Dunett multiple comparison tests, *p < 0.05, **p < 0.01, ***p < 0.001). Underlying data can be found in S1 Data. AP, action potential; CA3, Cornu Ammonis 3; D-AP5, D-2-amino-5-phosphonovalerate; EPSC, excitatory postsynaptic current; LSM, laser scanning microscope; LTD, long-term depression; ns, not significant; PPR, paired-pulse ratio; sEPSC, spontaneous EPSC; stim, stimulation.

