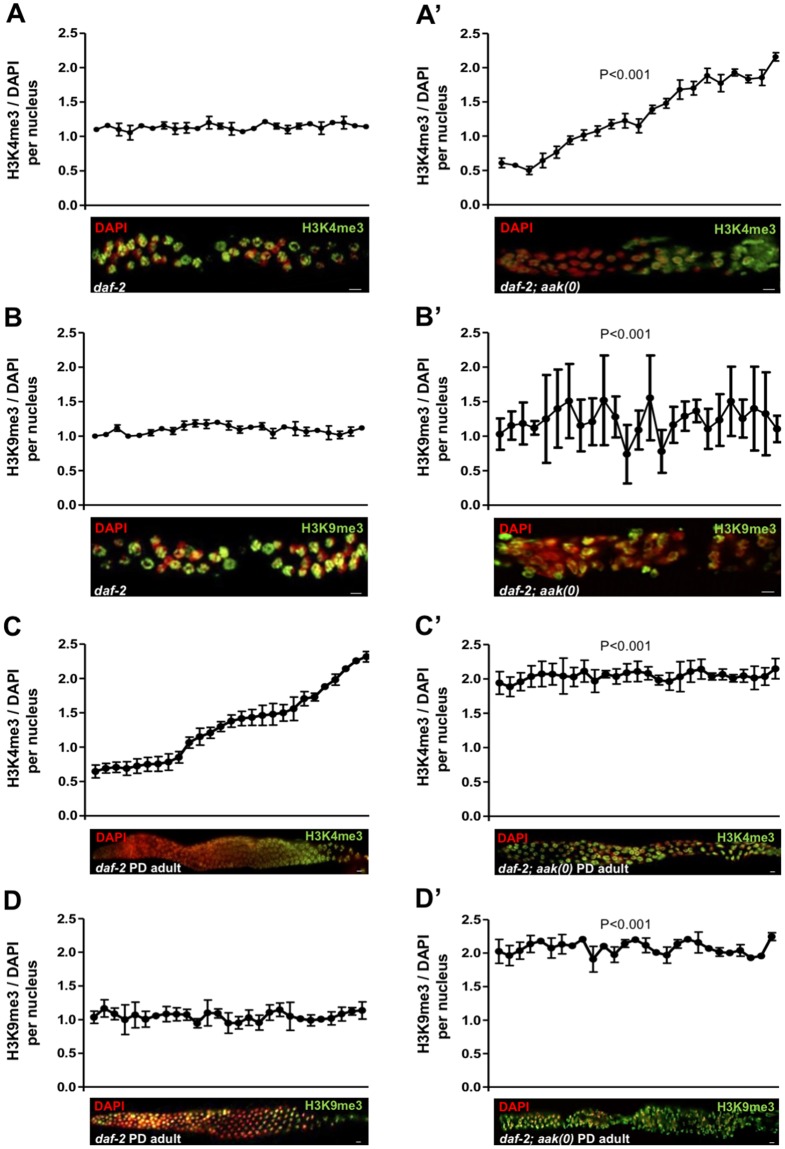
Fig 5. The distribution and abundance of both activating and repressive chromatin marks are dramatically altered in the aak(0) dauer and PD germ cells.
All images are merged, condensed Z stacks. The graphs represent the average immunofluorescence signal of anti-H3K4me3 and anti-H3K9me3 normalized to DAPI across the dissected germ line. For the micrographs of daf-2 dauer gonads, the entire dauer gonad was analyzed (distal, proximal, distal). Because of technical difficulties, only a single gonadal arm of the daf-2; aak(0) gonad was analyzed (distal, proximal). Images in A′, B′, C, C′, D, and D′ are aligned such that distal is left side and the proximal is right. (A, A′) The left panel (daf-2) and right panel (daf-2; aak(0)) show H3K4me3 (green), and in (B, B′), H3K9me3 (green) staining merged with DAPI (red). (C–C′, D–D′) PD daf-2 and daf-2; aak(0) adult gonads were extruded and stained with anti-H3K4me3 and H3K9me3 (green), and signal intensity was quantified throughout the gonad using Image J software. **P < 0.001 using the F-test for variance when compared to daf-2; aak(0). Scale bar: 4 μm, n = 15 for all the experiments. Underlying data can be found in S1 Data. aak, AMP-activated Protein Kinase subunit; DAF, DAuer Formation abnormal; H3K4me3, histone H3 lysine 4 trimethylation; H3K9me3, histone H3 lysine 9 trimethylation; PD, post-dauer.

