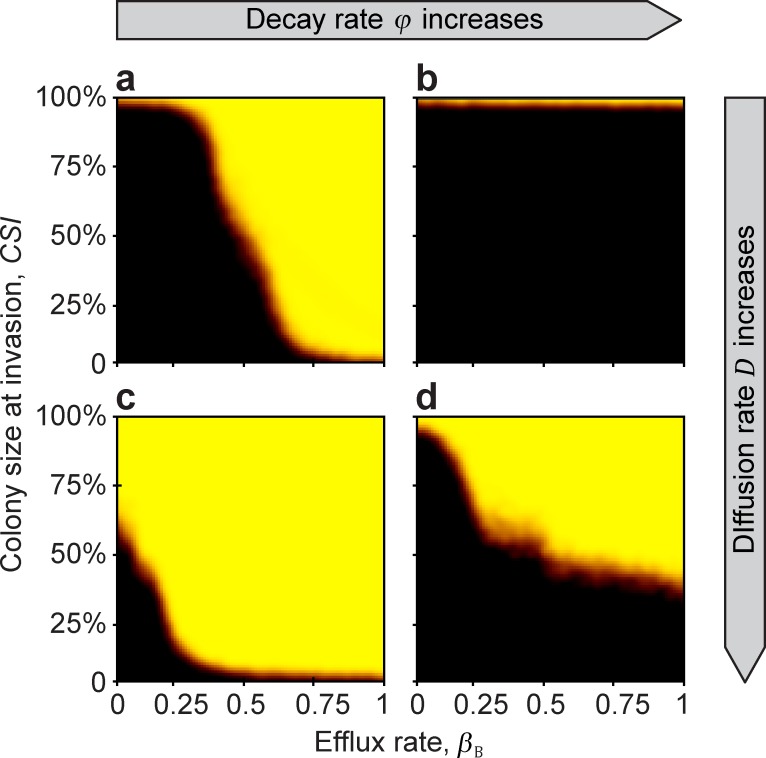
Fig 4. The effect of efflux rate, decay rate, and diffusion rate on the MSC.
At low diffusion rates (upper row), efflux rate limits the success, while at large diffusion rate (bottom row), colony size is the more limiting factor. From left to right (a→b, c→d) extracellular decay rate increases (φ = 0.7 and 0.9). From the top to the bottom (a→c, and b→d), diffusion rate increases (D = 0.5 and 12), respectively. Model parameters are: rB,0 = 0.8, rP,0 = 0.8, c = 0.1, ρB,0 = 1, αB = 0.6, αP = 0.6, βP = 0, γB = 0.3, γP = 0.3, a = 1, T = 1, k = 25, N = 10 000, nB,0 = 100, nP,t = 10, κ = 300, f = 0.01, Δt = 1/10, u = 100, ε = 0.01, r+ = 0, s+ = 0, ρ+ = 0, and τ = 0.

