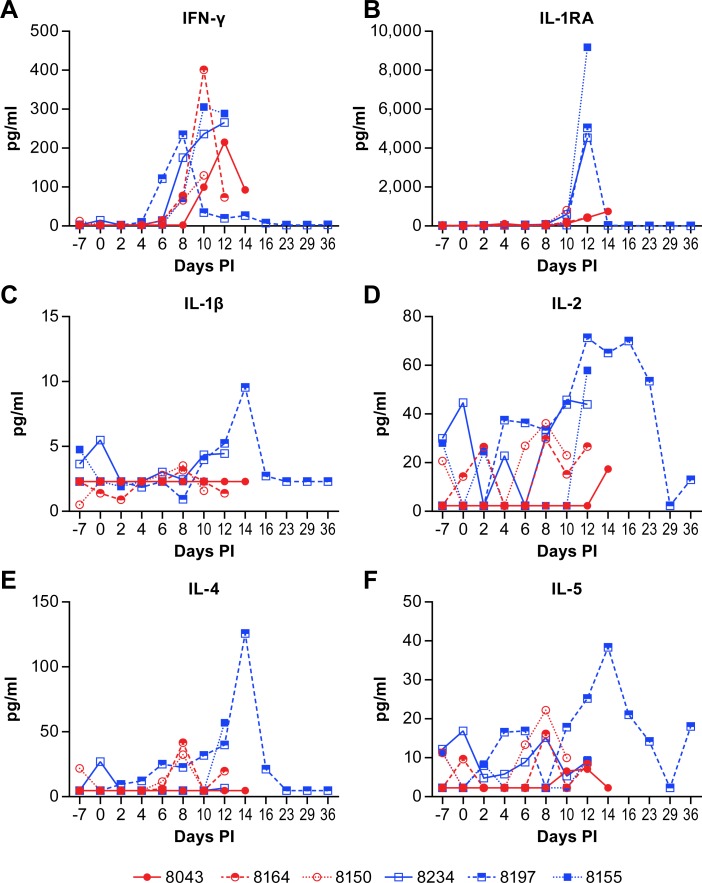
Fig 2. Plasma cytokine levels in animals infected with NiV.
IFNγ (A), IL-1RA (B), IL-1β (C), IL-2 (D), IL-4 (E) and IL-5 (F) levels in individual animals over the course of disease following NiV infection. Animals in the low dose group are displayed as red circles and those in the high dose group as blue squares. Values represent the mean of triplicate technical replicates.

