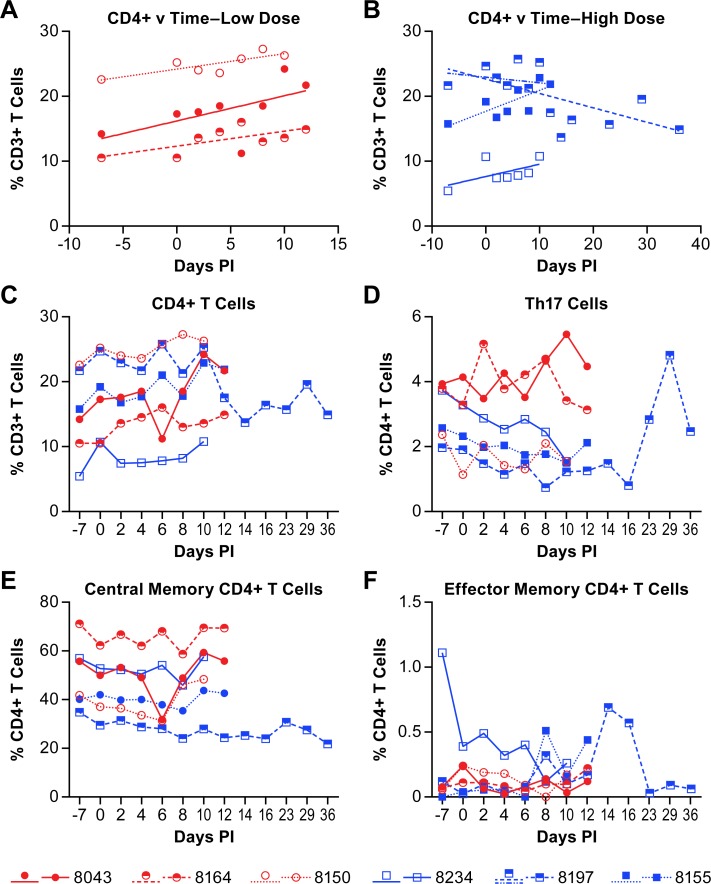
Fig 5. Changes in CD4+ T cell populations in animals infected with NiV.
The percent of CD4+ T cells within the CD3+ cell population of individual animals is provided in panels A-C. Linear regression analysis of the low dose group (A) and high dose group (B) was performed to determine the rate of change of the CD4+ T cell population over the course of disease. The r-values for the linear regression analyses are provided in S1 Table. Linear regression analysis was performed on samples from all animals through day 12 (acute phase) with additional analysis of the surviving animal over the entire course of disease (blue dashed line). The population of Th17 cells (D), central memory CD4+ T cells (E) and effector memory CD4+ T cells (F) were determined within the total population of CD4+ cells. The cell surface markers for defining individual populations is provided in S3 Table.

