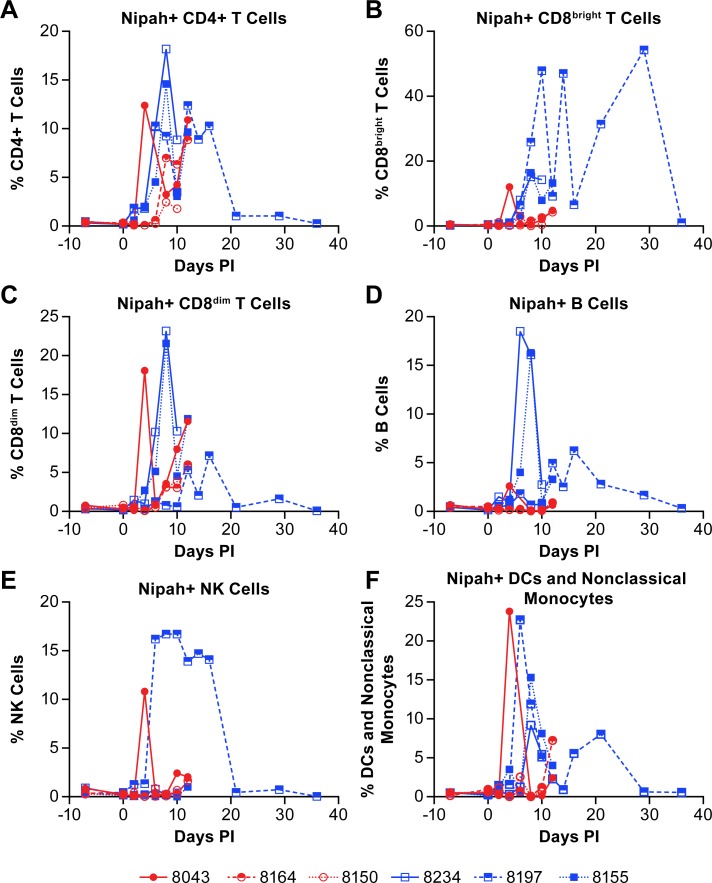
Fig 11. Determination of cell populations containing NiV antigen.
The presence of NiV was determined in individual cell populations by flow cytometry. Antigen was identified in CD4+ T cells (A), CD8bright T cells (B), CD8dim T cells (C), B cells (D), NK cells (E) and a combined population of DCs and non-classical monocytes (F). Red circles indicate the low dose group and blue squares indicate the high dose group. The cell surface markers for defining individual populations is provided in S3 Table.

