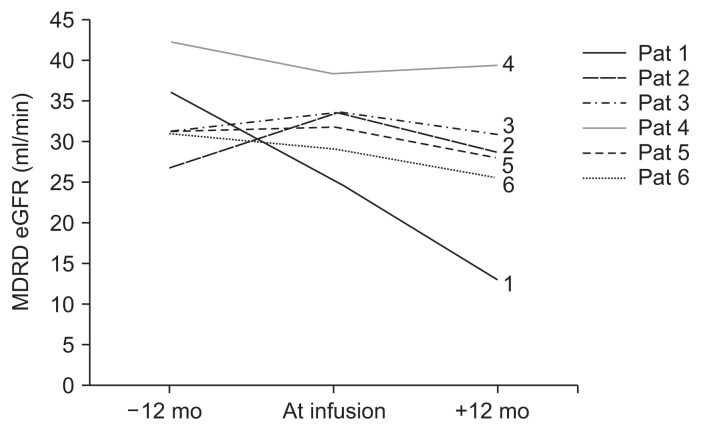
Figure 3. Glomerular filtration rate (GFR) before and after AT-MSC administration.
Renal function estimated by plasma creatinine and MDRD estimated GFR (eGFR) at 12 months before and after the injection of AT-MSCs. All individual cases, with the exception of patient 4, demonstrated a slight percent decrease of the MDRD eGFR, ranging from 7.5% to 49%. The eGFR slopes from the regression analysis of each patient prior to therapy and after therapy were not significantly different. For visual simplification of curves only the main three time points are depicted (12 months prior to treatment, time of infusion, 12 months post-treatment). AT-MSCs, adipose tissue-derived mesenchymal stromal cells; MDRD, Modification of Diet in Kidney Disease.

