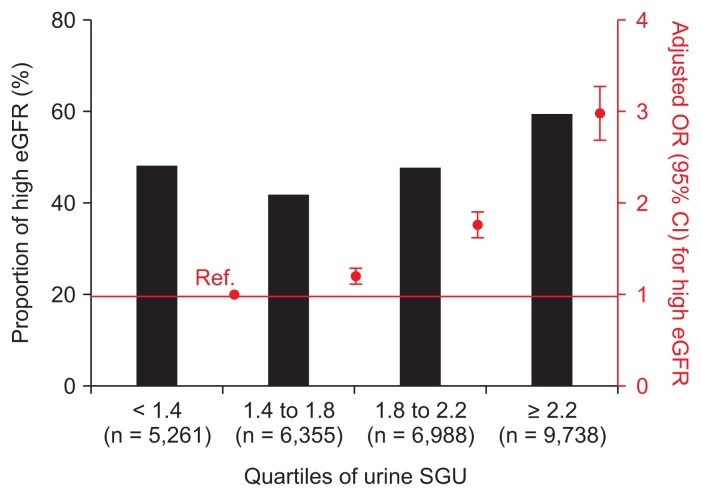
Figure 2. Odds ratio (OR) of urine SGU quartiles for high eGFR.
Black bar graphs represent the percentage of patient with low eGFR. Red square dots represent OR and red bars represent the 95% confidence interval (CI) using multivariate logistic analysis adjusted for age, sex, systolic and diastolic blood pressure, pulse rate, diabetes, dyslipidemia, cardiovascular disease, waist circumference, proteinuria, smoking and alcohol drinking habits, urine sodium and creatinine, and high water intake.
eGFR, estimated glomerular filtration rate; Ref., reference; SGU, specific gravity unit.

