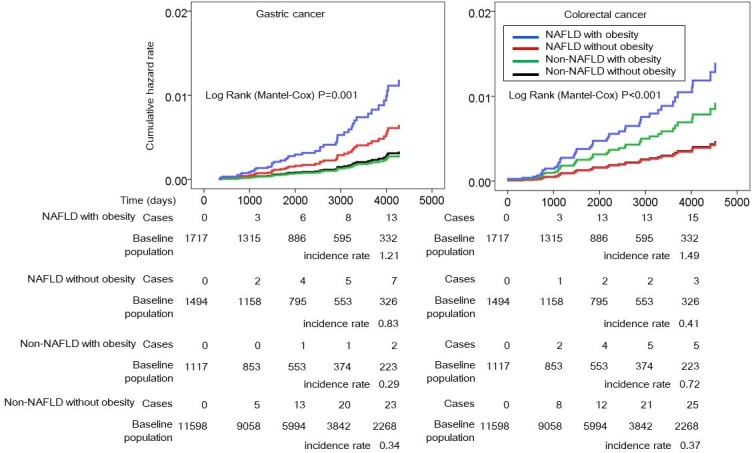
Figure 2.

HRs of NAFLD with or without obesity for incident gastric cancer and colorectal cancer. The vertical axis shows the cumulative hazard rate for gastric cancer and colorectal cancer, and the horizontal axis indicates the observational time in days. The blue lines represent NAFLD with obesity, the red lines indicate NAFLD without obesity, the green lines indicate non-NAFLD with obesity and the black lines indicate non-NAFLD without obesity. NAFLD, non-alcoholic fatty liver disease.
