
Figure 2.
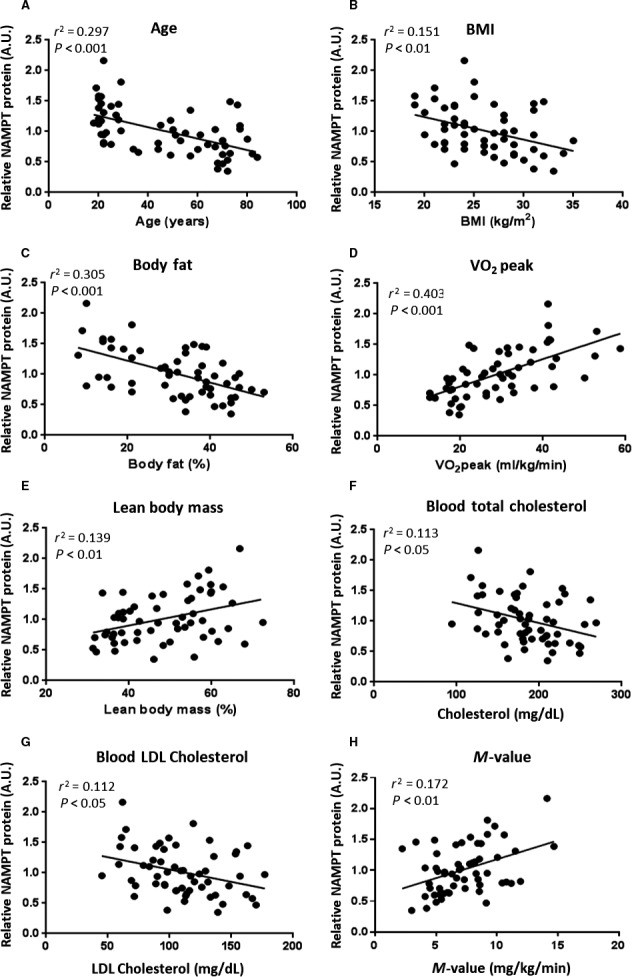
NAMPT protein levels in human skeletal muscle declines with increasing age and body fat. Correlation of the baseline skeletal muscle NAMPT with A, age (n = 57, r 2 = 0.297, P < 0.001)**; B, BMI (n = 57, r 2 = 0.151, P < 0.01)*; C, body fat (n = 57, r 2 = 0.305, P < 0.001)*; D, VO2peak (n = 57, r 2 = 0.403, P < 0.001)*; E, lean body mass (n = 57, r 2 = 0.139, P < 0.01)**; F, total blood cholesterol (n = 57, r 2 = 0.113, P < 0.05)*; G, blood LDL cholesterol (n = 57, r 2 = 0.112, P < 0.05); H, M‐value (n = 57, r 2 = 0.172, P < 0.01)*. *Pearson correlation coefficient, r was used. Significance of Pearson coefficient was tested using the t‐distribution. **Spearman correlation coefficient, r s was used.